
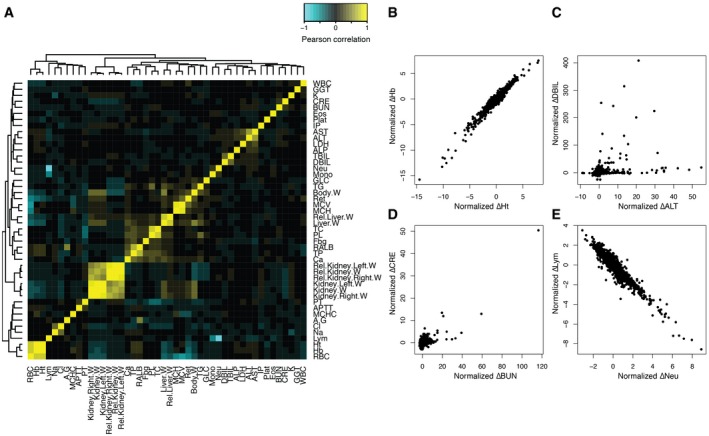
Figure EV1. Physiological parameters and their correlations.
-
AHeatmap showing Spearman correlation coefficients between physiological parameters across 3,564 conditions.
-
B–EScatter plots of four parameter pairs across 3,564 samples. Note that each parameter of each treatment was normalized by subtracting control vehicle treatments and divided by interquartile range IQR across all 3,564 conditions. (B) Example of strong positive correlation: Ht and Hb. (C) Comparison of two liver injury markers: ALT and DBIL. (D) Comparison of two kidney injury markers: BUN and CRE. (E) Example of strong negative correlation: Neu and Lym.