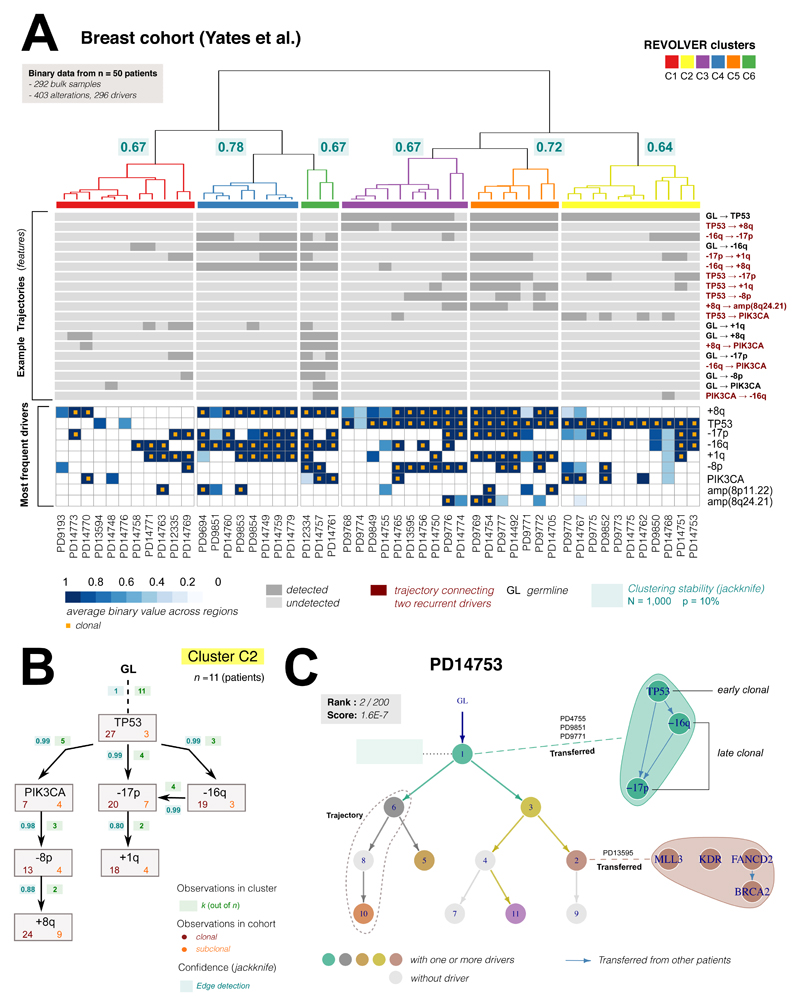
Figure 4. Repeated evolutionary trajectories in breast cancer.
(A) REVOLVER analysis of data from n = 50 breast cancers from Yates et al. 201515 (columns are patient). Top heatmap shows the most common repeated evolutionary trajectories identified by our method (GL:germline, complete data in Supplementary Figure 12). Bottom heatmap shows most recurrent putative driver genes reported as average CCF values as provided in15 (data were presence/absence). Alterations are ordered by frequency in the cohort, truncal alterations annotated with orange squares. REVOLVER stratified this cohort in 6 evolutionary subgroups characterized by repeated evolution (Supplementary Figure 13). Subgroup stability was estimated via jackknife (N = 1,000 resamples, leave out p = 10%; Supplementary Figure 14), and annotated in the dendrogram (median per cluster). (B) Repeated trajectories in cluster C2. In each edge of the graph we report the number of times a transition x → y is observed in the group, which contains 11 patients. For each alteration, we also annotate the number of times it is clonal or subclonal in the cohort, as well as the probability of detecting the edge across resamples. This group highlights the evolutionary trajectory TP53→PIK3CA→-8p→+8q. (C) The clone tree for patient PD14753 (cluster C2) had 11 nodes, 7 of which containing drivers (in colour). With a standard approach, this tree would have scored 2/200 alternative trees. By transferring information from other patients in the cohort (dashed lines), REVOLVER can expand evolutionary transitions within the same node. In this case, we identified TP53 as tumour-initiating alteration (early clonal), followed by loss of 16q/17p (late clonal). Uncertainty on -16q and -17p ordering remains because of equally likely observations in the cohort. Transfer Learning also works at the subclonal level, identifying the trajectory FANCD2→BRCA2. The order of MLL3 and KDR remained uncertain.

