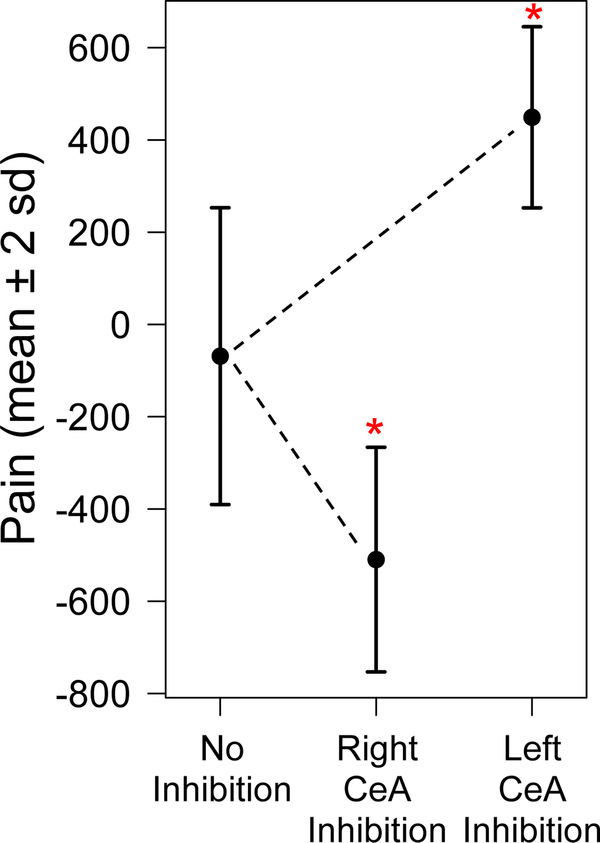
Figure 6:
Measurements of pain predicted by the model during inhibition of the left or right CeA. Pain values at time step 30 generated by 100 model simulations using neural activity during no inhibition of the CeA, inhibition of the right CeA, and inhibition of the left CeA. Circles represent average values and bars indicate ±2 standard deviations. Asterisks denote a significant change in average pain output during inhibition (P < 0.001).

