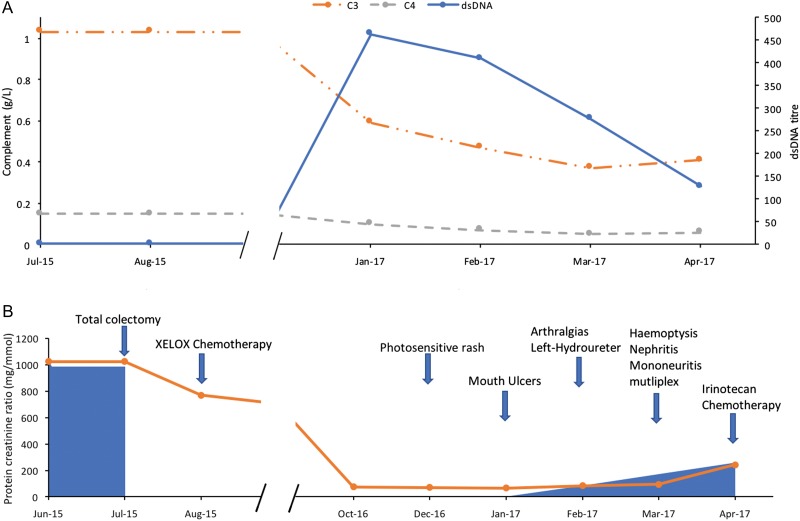
Figure 1:
Laboratory and clinical features of SLE according to time. (A) Solid blue line = anti-dsDNA antibody titre (IU/mL, normal <100 IU/mL), dashed grey line = C4 complement levels (g/L, normal: 0.16–0.47 g/L), dotted orange line = C3 complement levels (g/L, normal: 0.9–1.8 g/L). (B) Solid blue shade = apparent tumour volume, solid orange line = protein creatinine ratio (mg/mmol), blue arrows = development of relevant clinical symptoms and signs.

