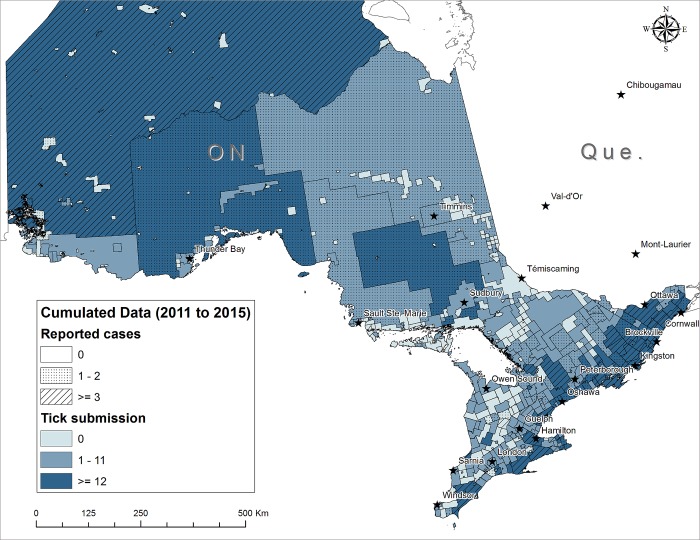
Fig 3. Geographic distribution of passive I. scapularis tick submissions (adults and nymphs) and total number of reported human Lyme disease cases in CSDs in Ontario from 2011 to 2015.
Dotted CSDs are areas with emerging risk (1–2 human Lyme disease cases). Hatched CSDs are endemic areas where ≥ 3 Lyme disease cases were acquired. Light blue CSDs are areas where the number of adult and nymphal is < 12, the optimal cut-off point as indicator of the human Lyme disease risk. Dark blue CSDs are areas where the number of I. scapularis submissions is ≥ 12.

