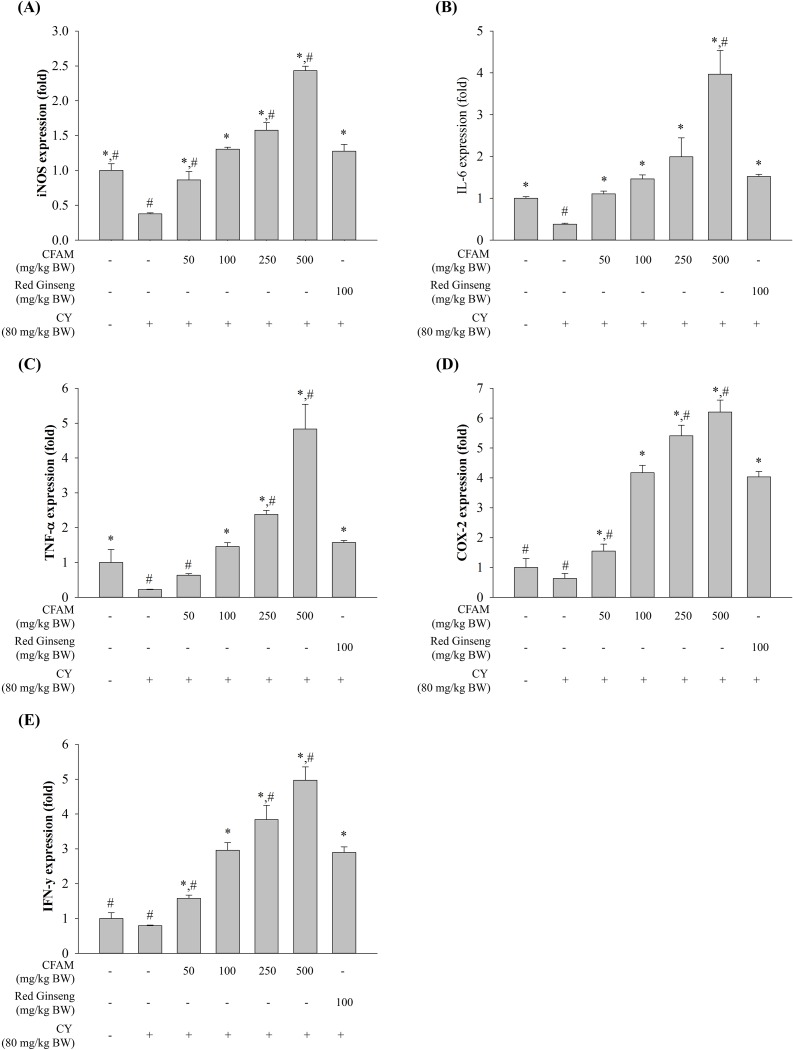
Fig 4. Relative expression (fold-change) of immune genes in LPS-stimulated peritoneal macrophages.
Peritoneal macrophages were stimulated with 1 μg/mL of LPS. After 24 h stimulation, total RNA was extracted from the stimulated cells. The cytokine expression was analyzed using the QuantStudio™ 7 FlexReal-Time PCR System. (A) iNOS, (B) IL-6, (C) TNF-α, (D) COX-2, and (E) IFN-γ. Significant differences were observed at P < 0.05 compared to the saline (*) and ginseng (#) groups.

