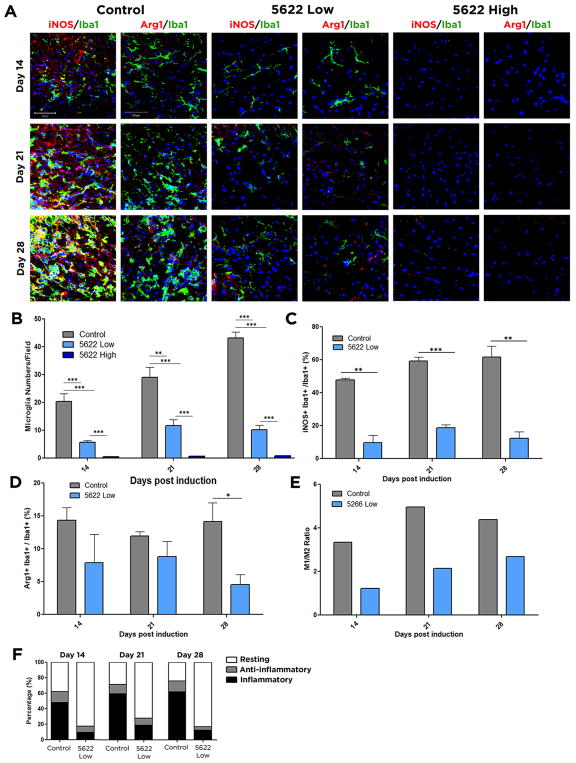
Figure 3. Microglial populations are less inflammatory following CSF1R inhibition.
Frozen spinal cord sections were isolated from control, PLX5622 high dose, or PLX5622 low dose treated mice at day 14, 21, and 28 days post induction of EAE. Microglia were stained using the marker Iba1 (green). To observe inflammatory cells, tissue was costained for iNOS (red), and for anti-inflammatory cells costained for Arg1 (red). DAPI is shown in blue (A). Total numbers of microglia per field are shown in (B). Inflammatory cells, identified by double staining for iNOS and Iba1, were quantified in (C), and anti-inflammatory cells, identified by double staining for Arg1 and Iba1 were quantified in (D). The ratio of the percentages of inflammatory cells relative to anti-inflammatory cells is shown in (E), and percentages of each population after treatment are indicated in (F). Data are mean ± SEM, and analyzed by one-way ANOVA followed by a Bonferroni post-test. n=3, *, p<0.05; **, p<0.01; ***, p<0.001; Scale bar: 50 μm.

