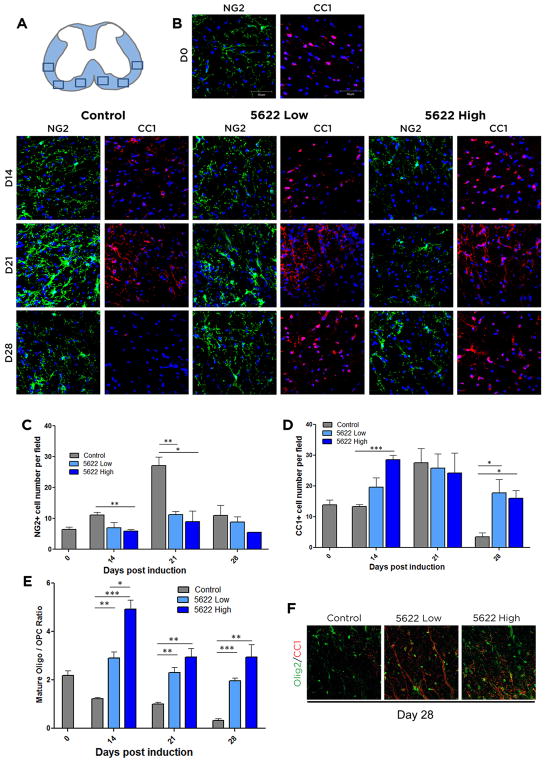
Figure 5. Oligodendrocyte populations are shifted towards a mature phenotype following CSF1R inhibition.
Frozen spinal cord sections were isolated from control, PLX5622 high dose, or PLX5622 low dose treated mice at day 14, 21, and 28 days post induction of EAE. Regions where images were taken is depicted in (A). To visualize OPCs, tissue was stained for NG2 (green). To visualize mature oligos, tissue was stained with CC1 (red. Cell nuclei are shown in blue (DAPI) (B). Numbers of NG2+ (C), CC1+ (D), and the ratio of CC1+/NG2+ cells per field (E) were calculated. Tissue isolated on D28 post-EAE induction was stained for Olig2 (green) to denote all oligodendrocyte lineage cells, and CC1 (red) to denote mature oligodendrocytes (F). Data are mean ± SEM, and analyzed by one-way ANOVA followed by a Bonferroni post-test. n=3, *, p<0.05; **, p<0.01, ***, p<0.001. Scale bar: 50 μm.

