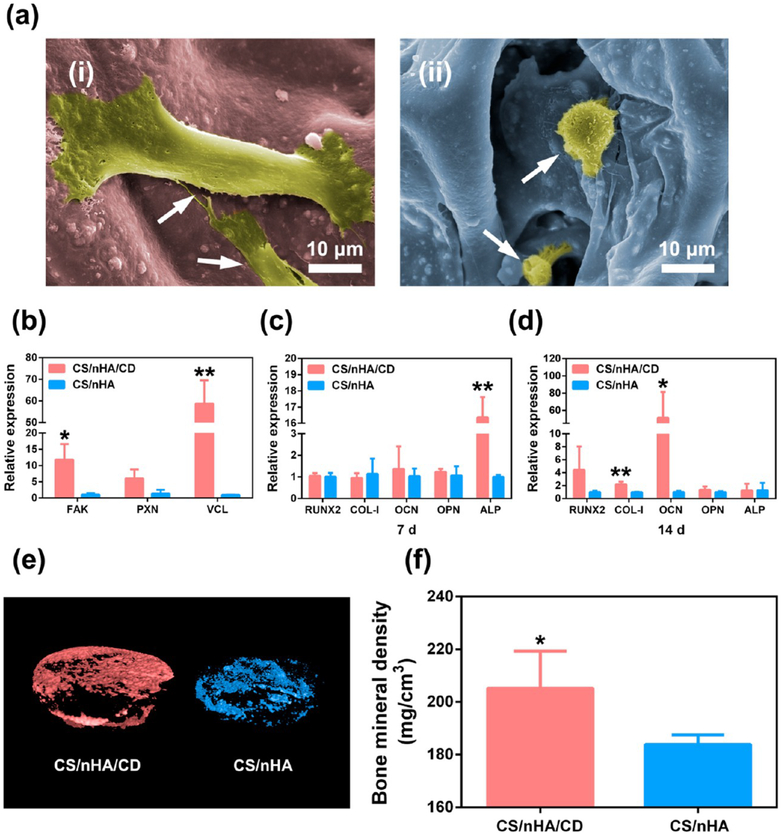
Figure 3.
Cell adhesion and osteogenesis. (a) Cell morphology within the scaffolds. (i), (ii) rBMSCs in the CS/nHA/CD and the CS/nHA scaffolds, respectively. rBMSCs (white arrows) exhibited more obvious spindle shapes and discrete filopodia in the CS/nHA/CD scaffolds than in the CS/nHA scaffolds. (b) The relative expression levels of genes related to cell adhesion in the scaffolds. Focal adhesion pathway genes expression of FAK and VCL was significantly higher in the CS/nHA/CD scaffolds. PXN expression was also higher in the CS/nHA/CD scaffolds. (c-d) Relative expression of osteogenesis-related genes after 7 and 14 days of culture, respectively. The expression level of ALP was significantly higher in the CS/nHA/CD scaffolds compared to the CS/nHA scaffolds on day 7, and the expression levels of COL-1 and OCN were significantly higher in the CS/nHA/CD scaffolds compared to the CS/nHA scaffolds on day 14. (e) Micro-CT 3D reconstruction models of the newly formed bone in the scaffolds. More new bone formation was found in CS/nHA/CD scaffolds at 4 weeks. (f) BMD of the new formed bone in the scaffolds. BMD was significantly higher in the CS/nHA/Cu scaffolds after 4 weeks of implantation. Each value is the mean ± standard deviation; *p < 0.05, **p < 0.01 compared to the CS/nHA scaffolds.

