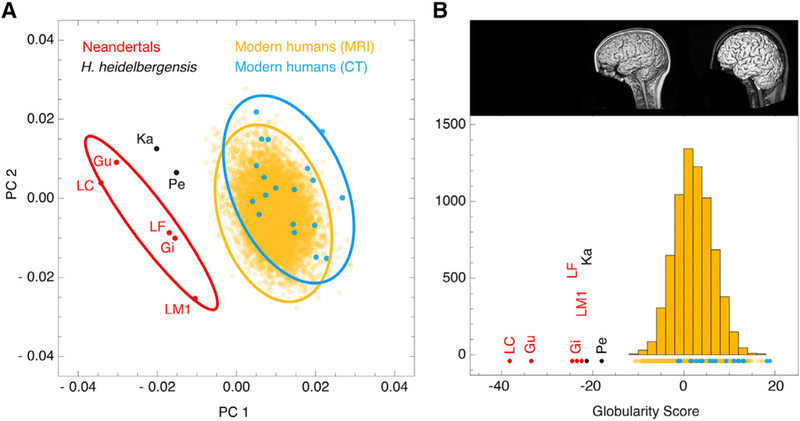
Figure 2. Globularity Scores of CT and MRI Scans.
(A) Principal component analysis of endocranial shape. 99% confidence ellipses are shown for modern human CT scans from Europe (blue; n = 19), MRI scans of present-day humans (yellow; n = 6,575), and Neandertal CT scans (red; n = 7); two Homo heidelbergensis individuals are plotted in black.
(B) Frequency plot of globularity scores computed for data shown in (A). This globularity score quantifies overall endocranial shape by projecting each individual onto the vector between the elongated average shape of Neandertals and the globular average shape of present-day humans. Inset shows example MRI scans associated with low (left) and high (right) globularity scores among present-day humans.
See also Figure S1.

