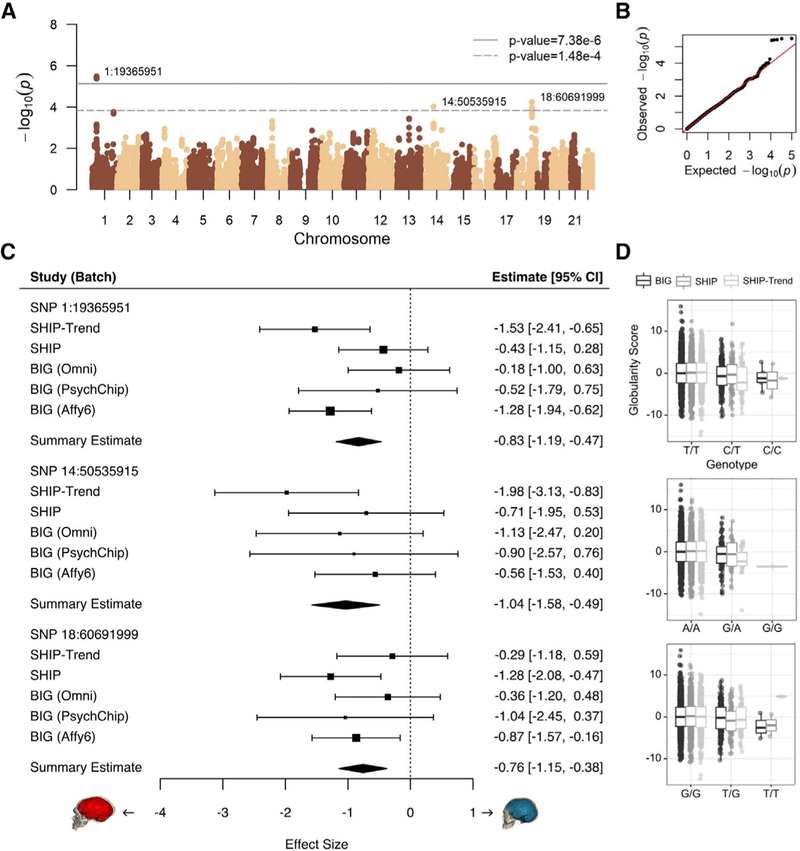
Figure 3. Endocranial Globularity in Modern Humans Is Associated with Introgressed Neandertal Haplotypes.
(A) Association statistics for introgressed Neandertal SNPs (solid line, significance, adjusted for multiple testing; dashed line, suggestive significance).
(B) Quantile-quantile plot of association p values, showing the expected uniform distribution, with the outliers representing significant associations.
(C) Forest plots depict the effects of the top Neandertal SNPs, for each study and genotyping batch. Boxes are proportional to weight, with whiskers representing the 95% confidence interval; diamonds represent a linear mixed-effect model incorporating all five datasets.
(D) Covariate-corrected globularity scores by genotype. All data points are shown; boxes represent 25th and 75th percentiles; whiskers represent 1.5 times the interquartile range.

