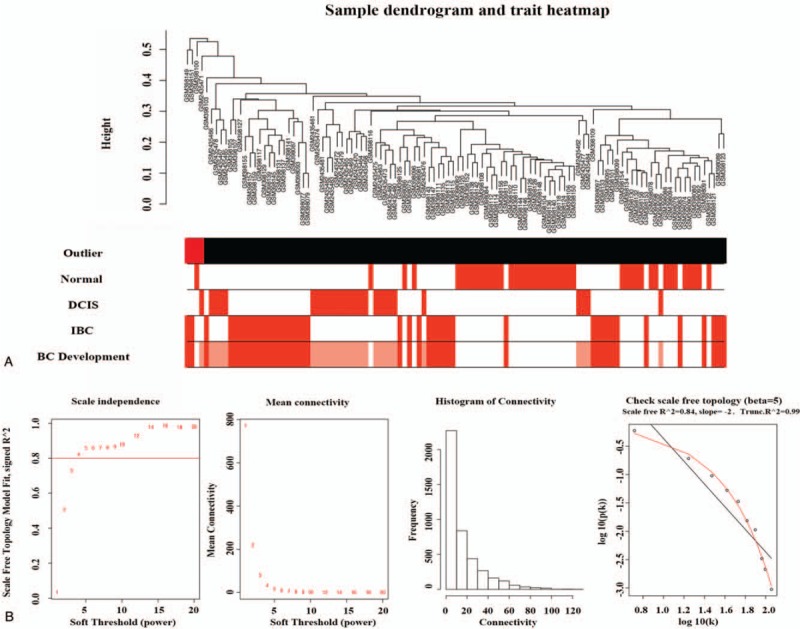
Figure 1.

(A) Cluster tree of normal, DCIS and IBC samples. The first color-band underneath the tree indicates which arrays appear to be outlying (colored red). The other color bands color-code the sample traits. The BC development in Figure 1 means the dynamic changes of gene expression from normal to DCIS and then to IBC. (B) Analysis of network topology for various soft-thresholding powers. BC = breast cancer, DCIS = ductal carcinoma in situ, IBC = invasive breast cancer.
