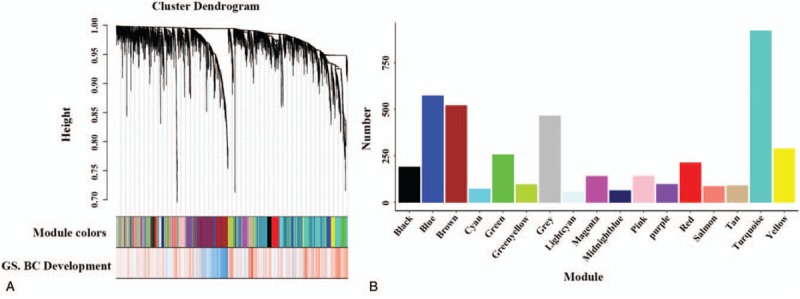
Figure 2.

(A) Hierarchical cluster tree of the 4236 genes. The first band shows the assigned module colors and the second color band represents the gene significance measure: “red” indicates a high positive correlation with BC development. (B) The number of genes in the 17 modules. BC = breast cancer.
