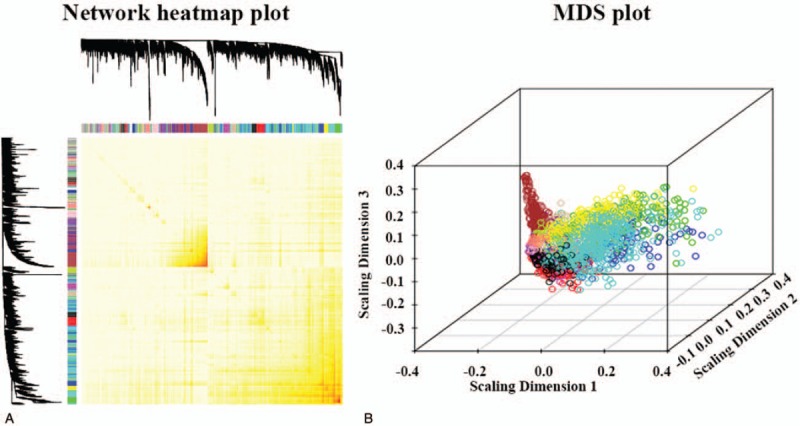
Figure 3.

(A) Heatmap plot representing the gene network. The heatmap depicts the topological overlap matrix among all genes in the analysis. (B) Multi-dimensional scaling (MDS) plots representing the entire gene expression network. Each gene is represented by a dot, where the color of the dot corresponds to the gene module to which that gene belongs.
