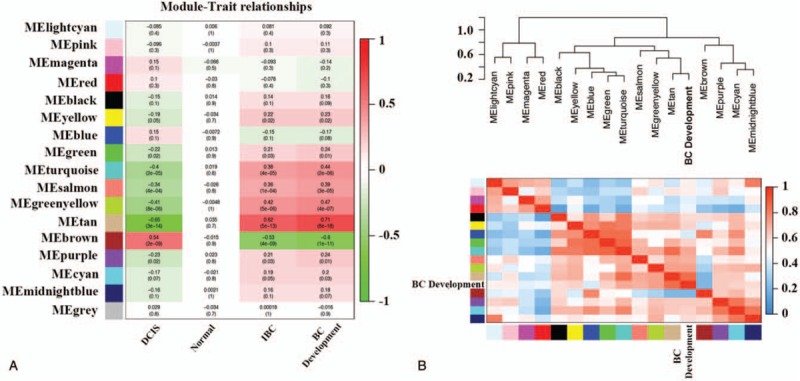
Figure 4.

(A) Pearson correlation coefficient matrix among module eigengenes (MEs), and breast cancer characteristics. Each cell reports the correlation (and P-value) between module eigengenes (rows) and traits (columns). (B) Eigengene network representing the relationships among the modules and the sample traits. BC = breast cancer, MEs = module eigengenes.
