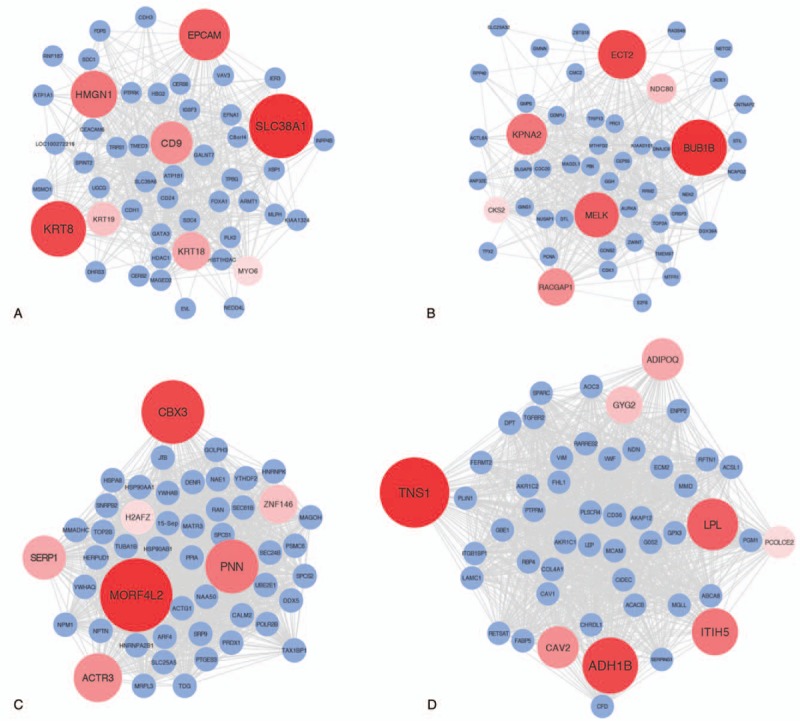
Figure 8.

Visualization of weighted gene co-expression network analysis (WGCNA) network connections of the intramodular hub genes and the top 50 genes in tan (A), green-yellow (B), turquoise (C) and brown (D) module.

Visualization of weighted gene co-expression network analysis (WGCNA) network connections of the intramodular hub genes and the top 50 genes in tan (A), green-yellow (B), turquoise (C) and brown (D) module.