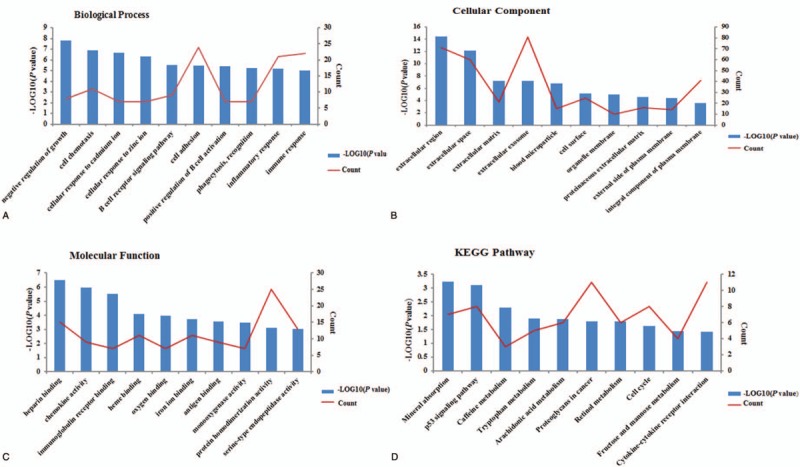
Figure 1.

Results of GO analysis and KEGG pathway enrichment analysis of the differentially expressed genes (DEGs). The x-axis indicates the functional annotations or significantly enriched KEGG pathways. The left y-axis indicates the –log10 (P value). The right y-axis indicates the number of enriched genes. GO = Gene ontology. KEGG = Kyoto encyclopedia of genes and genomes.
