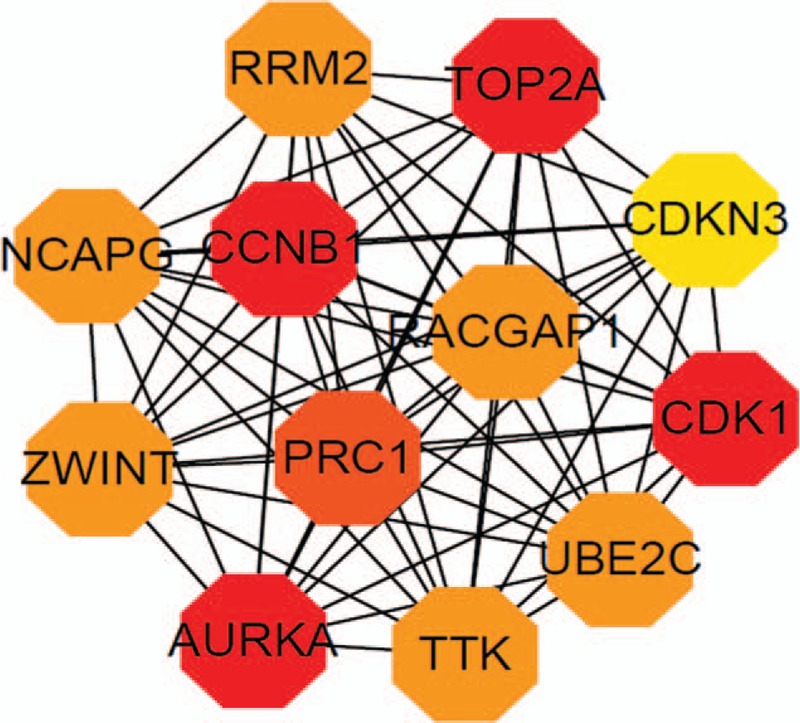
Figure 3.

Visualization of the hub genes selected from the PPI network using the maximal clique centrality algorithm and the cytoHubba plugin. Edges represent the protein-protein associations. Red octagons represent differentially expressed genes (DEGs) with the high PPI scores. Yellow octagons represent differentially expressed genes (DEGs) with the low PPI scores. PPI = Protein-protein interaction.
