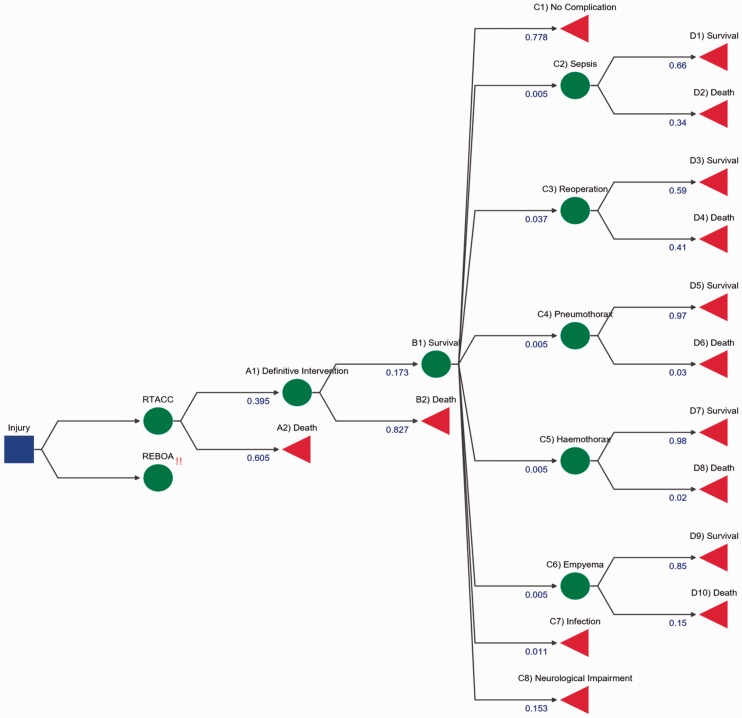
Figure 2.
RTACC decision tree. The initial decision node is demonstrated by a blue box, where a decision for an intervention occurs, in this case RTACC. The chance nodes are represented by green circles whereby probability dictates which node is travelled down. Terminal nodes are represented by red triangles which highlight the end of the path and outcome of the journey. Each blue number under the node title is representative of weighted probabilities of a patient undertaking the route. For example, Death and Survive (B nodes) should add up to 1. Numbers on the diagram are rounded for display purposes and may not add up to 1.

