
Figure 4.
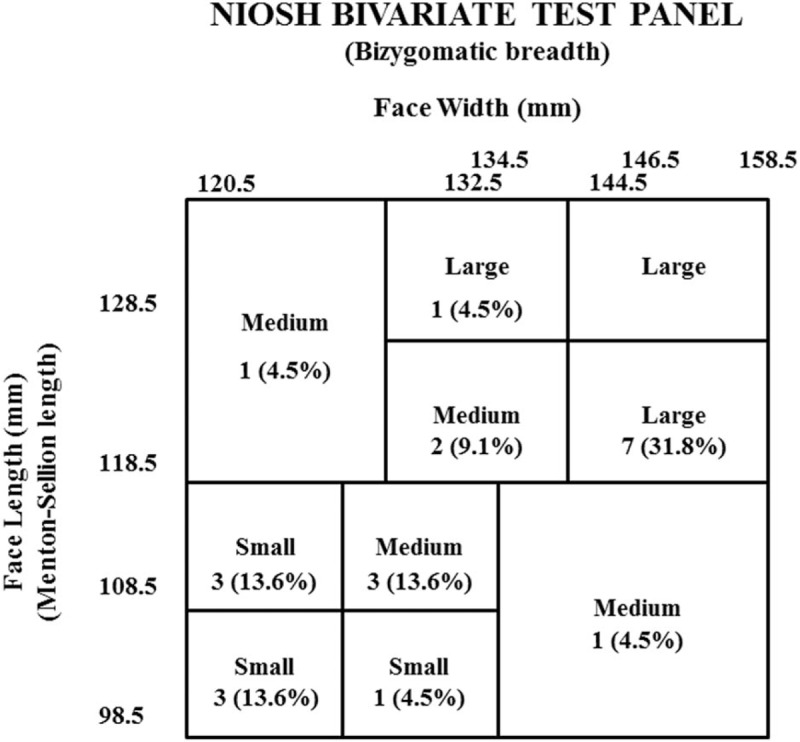
Distribution of participants according to the NIOSH bivariate panel. Categorical variables are given as numbers (percentage). Eight participants were large, 7 were medium, and 7 were small.
Official websites use .gov
A
.gov website belongs to an official
government organization in the United States.
Secure .gov websites use HTTPS
A lock (
) or https:// means you've safely
connected to the .gov website. Share sensitive
information only on official, secure websites.
Distribution of participants according to the NIOSH bivariate panel. Categorical variables are given as numbers (percentage). Eight participants were large, 7 were medium, and 7 were small.