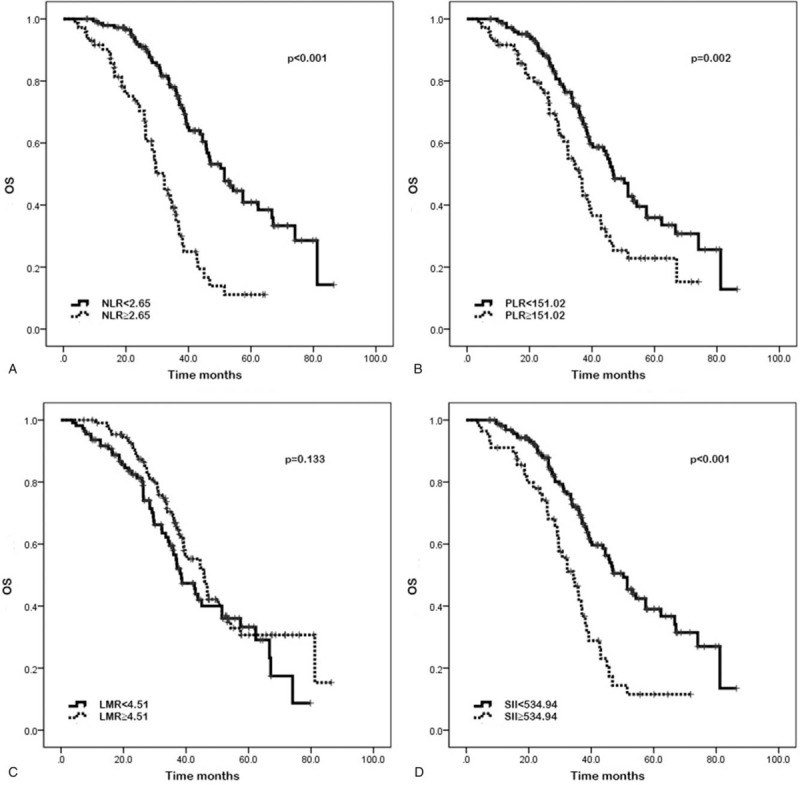
Figure 2.

Kaplan–Meier curves of overall survival (OS) based on pretreatment neutrophil-to-lymphocyte ratio (NLR) (A), platelet-to-lymphocyte ratio (PLR) (B), lymphocyte-to-monocyte ratio (LMR) (C), and systemic immune-inflammation index (SII) (D). Elevated NLR, PLR, and SII were significantly associated with poor OS (P < .001, P = .002, and P < .001, respectively). LMR was not significantly associated with OS (P = .133).
