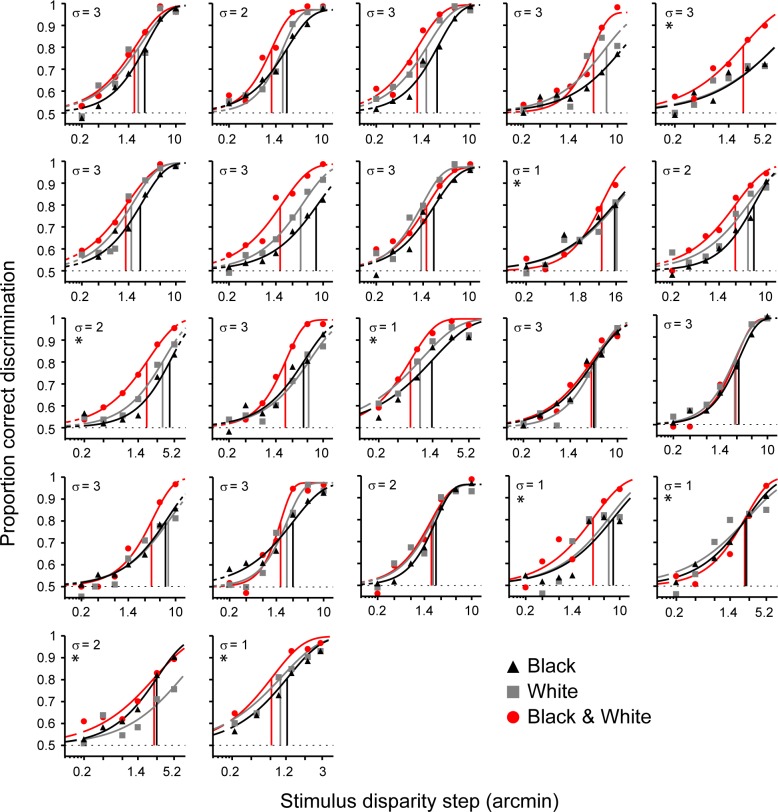
Figure 2.
Discrimination performance for RDSs with black dots, white dots, and a mixture of black and white dots. Task difficulty is defined by two parameters: the disparity offset in the RDS (x-axis) and the disparity noise assigned to each dot in the RDS (sampled from Gaussian with a SD (σ) in arcmin). Psychometric functions were fitted to mean proportion correct responses. For 14 participants, the upper asymptote was set to performance at lapse trials (see Methods). For eight participants no lapse data was available (marked with *) and the upper asymptote was set to the average group lapse rate. Vertical lines mark the threshold at which participants performed at 80% correct for each condition.

