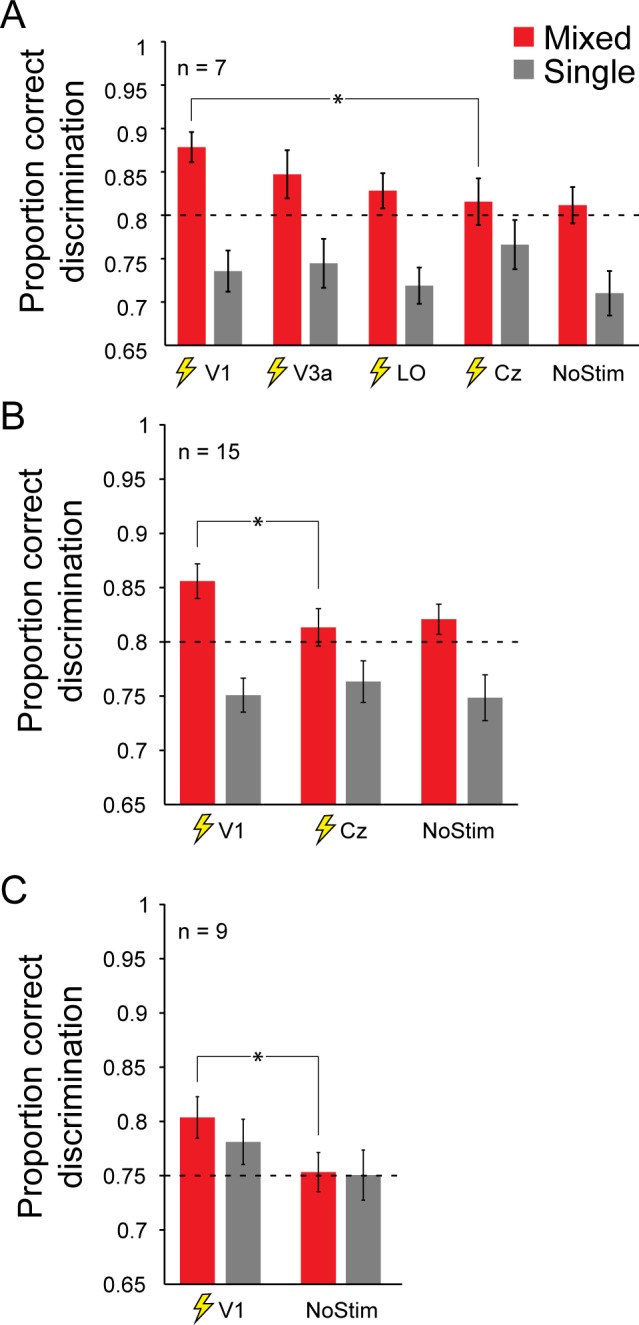
Figure 3.

Mean discrimination performance for different stimulation conditions. Error bars depict 1 SEM. Results are shown for stimulus location left of fixation. Brain stimulation was applied to right hemisphere visual cortex. (A) Results for all stimulation conditions investigated in this study (n = 7). (B) Results for V1 stimulation investigated for a larger sample size (n = 15). (C) Replication of V1 stimulation effect of main experiment (n = 9). Additionally, task difficulty for mixed and single polarity was adjusted so that participants had similar proportions of correct responses for both stimulus conditions prior to brain stimulation. This was done to control whether TMS effects depend on task performance.
