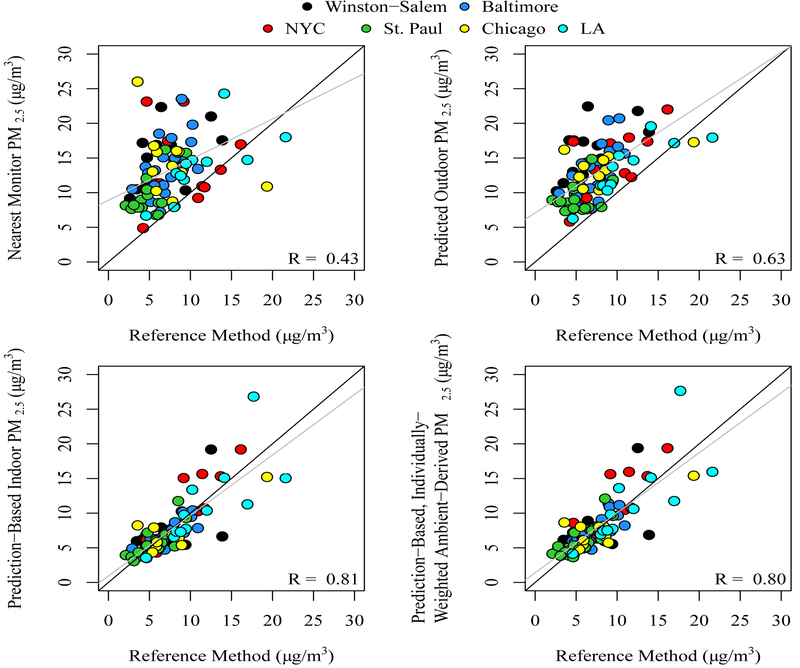
Figure 2.
Comparison between reference method ((Sulfur2.5-pers/ Sulfur2.5-out) * PM2.5-out(m)) and each of four exposure metrics: 1) Average concentration at nearest regulatory monitor, 2) outdoor (PM2.5-out(p)), 3) indoor (PM2.5-in(p)), and 4) individually-weighted, ambient derived (PM2.5-out(p) * tout-MAQ)) + Finf(p) * PM2.5-out(p) * (1 - tout-MAQ)) for 91 rounds of 2-week sampling. All metrics are ambient origin PM2.5, not total PM2.5.
Notes: Predicted outdoor PM2.5 is expected to be higher than personal exposure due to the attenuation by infiltration and time spent indoors. The 1-1 line (black) and best fit line (gray) are shown for reference.

