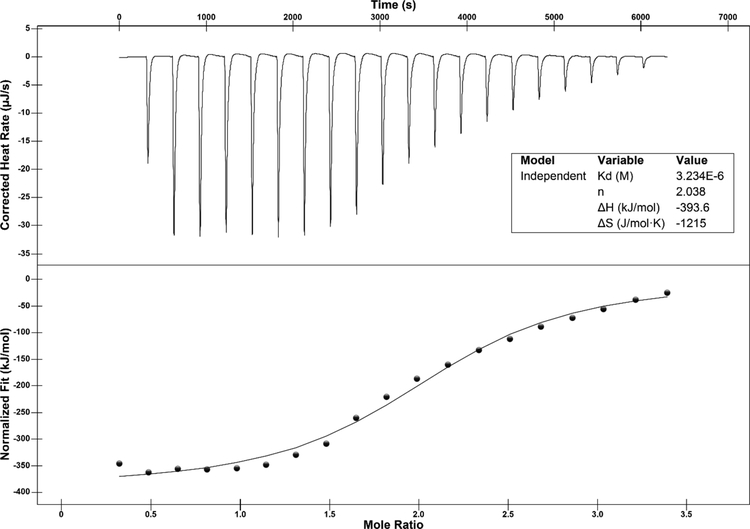
Figure 12. ITC analysis of NaMN binding to MjCobT.
Sample preparation for ITC analysis is described in detailed under Materials and Methods. Twenty 2.4-μL injections of 1 mM NaMN spaced every 5 min were made during the course of the experiment. The top panel shows the heat released per injection. The interaction between MjCobT and NaMN is shown as enthalpy per mol of NaMN injected as a function of the molar ratio of protein to ligand (bottom panel). The binding isotherm was obtained from the integrals of the peaks. Shown in the inset are the best-fit values for the dissociation constant (Kd), stoichiometry (n), enthalpic change (ΔH), and entropic change (ΔS).

