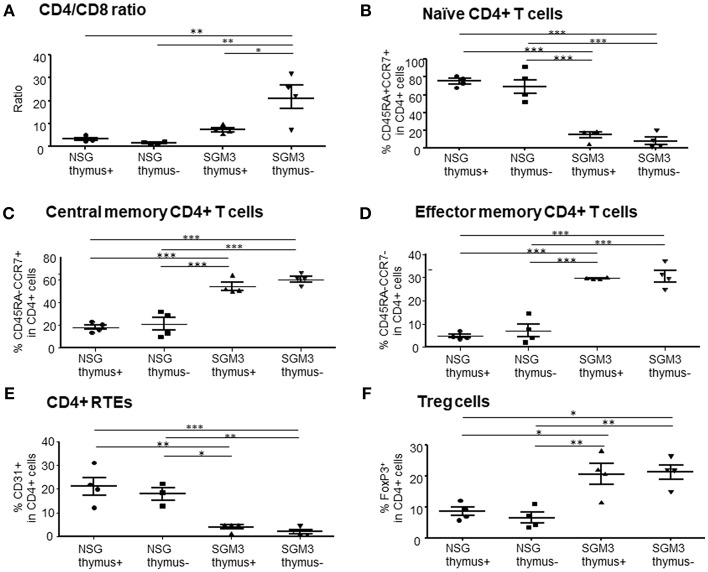
Figure 2.
Characterization of human T cells in huNSG and huSGM3 mice with or without human thymus. Human T cells in peripheral blood at 15 weeks after transplantation were analyzed for the frequencies of T cell subsets (n = 4 per group). (A) Ratios of human CD4+ to CD8+ T cells within CD3+ population. (B) Percentages of human CD45RA+CCR7+ naïve CD4 T cells. (C) Percentages of human CD45RA−CCR7+ central memory CD4 T cells. (D) Percentages of human CD45RA−CCR7− effector memory CD4 T cells. (E) Frequencies of CD31+CD45RA+ recent thymic emigrant CD4 T cells. (F) Frequencies of human FoxP3+CD25hi Treg cells. Group differences were determined by one-way ANOVA with Bonferroni's post-hoc multiple comparison test; each symbol represents an individual mouse. *P < 0.05; **P < 0.01; ***P < 0.001. Error bars indicate SEMs.

