FIGURE 2.
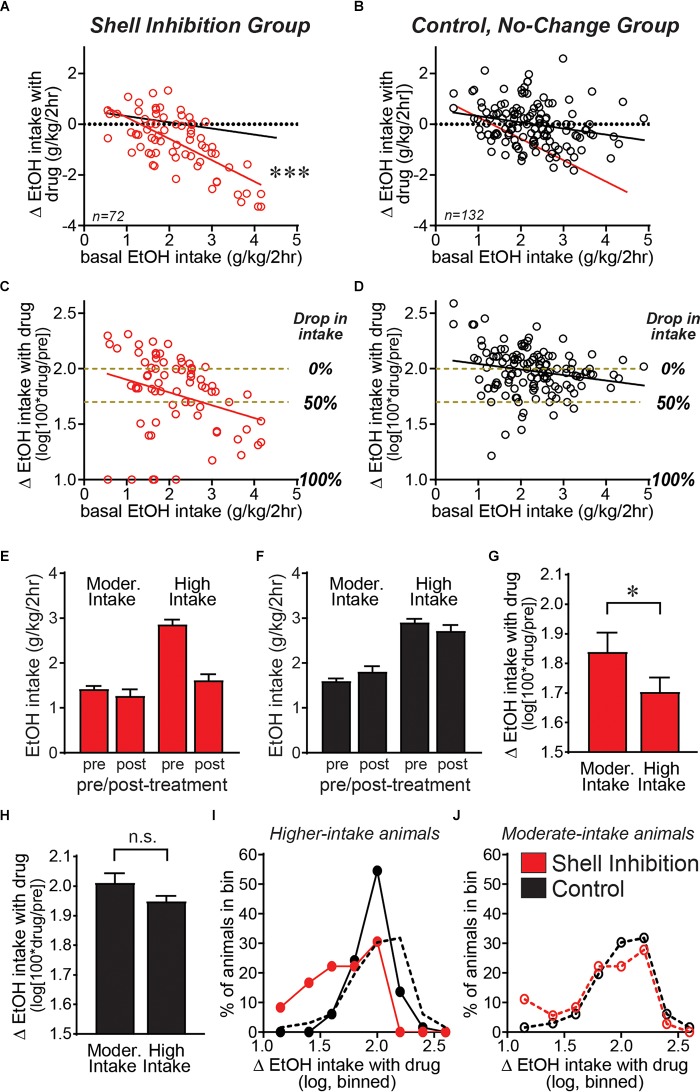
Shell Ox1Rs and activity were important for driving alcohol intake predominantly in higher-drinking individuals. Data combined from Shell inhibition groups (A) and separately combined from control (no-change) groups (where drug treatment had no impact on alcohol drinking) (B) examining how treatment-related drinking change relates to basal alcohol intake levels across individuals (basal consumption determined from vehicle-injected test sessions). The slope of the Shell Inhibition group (red line in A,B) was significantly greater than the slope in Control group (black line in A,B). (C,D) We next calculated the drug-related drinking change relative to basal intake levels in each animal: log[100∗(intake during drug treatment)/(intake during vehicle)]. Subjects with higher basal drinking showed a significantly greater impact of Shell inhibition, relative to individuals with more moderate basal consumption. Since the change in intake with treatment is on a log scale, yellow–brown dashed lines are included to indicate no change in drinking (0% drop in intake with treatment) compared with 50% drop in intake, and 100% drop in intake is also indicated. (E–J) A median split was used to divide individuals into moderate and higher basal drinkers (Moorman and Aston-Jones, 2009; Alcaraz-Iborra et al., 2017; Moorman et al., 2017). (E,F) Alcohol intake pre- and post-treatment in moderate versus higher basal drinkers, where Shell inhibition strongly reduced alcohol intake levels only in higher drinkers. (G) Shell inhibition produced a significantly greater decrease in alcohol drinking in higher-drinkers relative to moderate-drinkers. (H) In the control group, there was no difference in treatment-related change between higher and moderate basal drinkers. (I,J) Histograms of the number of mice showing different levels of change in drinking with treatment, binned as described in Section “Materials and Methods.” (I) In higher-drinkers, control mice (black) showed a normal distribution with a strong peak at log value of 2, indicating 100% of basal intake (no change). In contrast, higher-drinking mice with Shell inhibition (red) showed a clear shift to the left, indicating inhibition of alcohol consumption. (J) In moderate-drinkers, there was little difference in the distribution between Shell inhibition mice (red) and controls (black). ∗p < 0.05, ∗∗∗p < 0.001.

