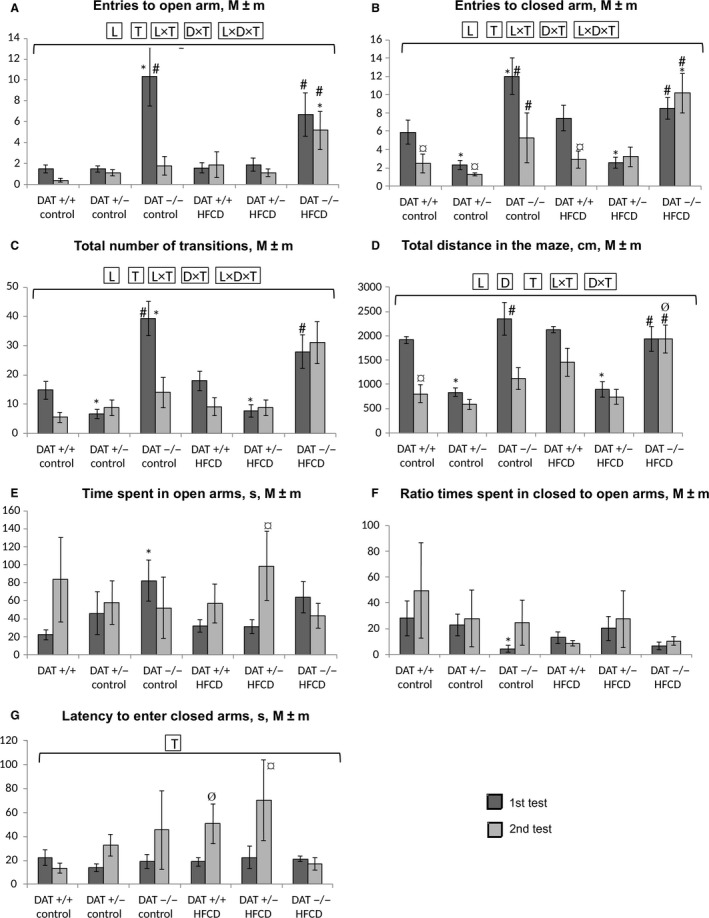
Figure 3.

Results of testing the level of anxiety, search activity, and mobility of rats in the EPM test in the first (on the 7th day) and second (on the 50th day) testing. (A) The number of OA visits; (B) the number of CA visits; (C) the total number of transitions between the maze zones; (D) the total distance traveled in the maze, cm; (E) the time spent in OAs, seconds; (F) the ratio of the CA/OA time; (G) the latency time before the first entry into the CA. Abscissa axis – groups of animals; Ordinate axis – the mean ± standard error of the indicator in the appropriate units. The number of animals per group – see Table 1. *The difference compared with the data from DAT −/− rats is significant; #The difference compared with the data from DAT +/− rats is significant; ¤The difference compared with the data from first test in corresponding group is significant; ØThe difference with the animals receiving the control diet is significant, P < 0.05 (the Wilcoxon–Mann–Whitney test); horizontal bracket – ANOVA P < 0.05 for “genotype” (L, line), “diet” (D), test (T) and their combinations by the covered range of values.
