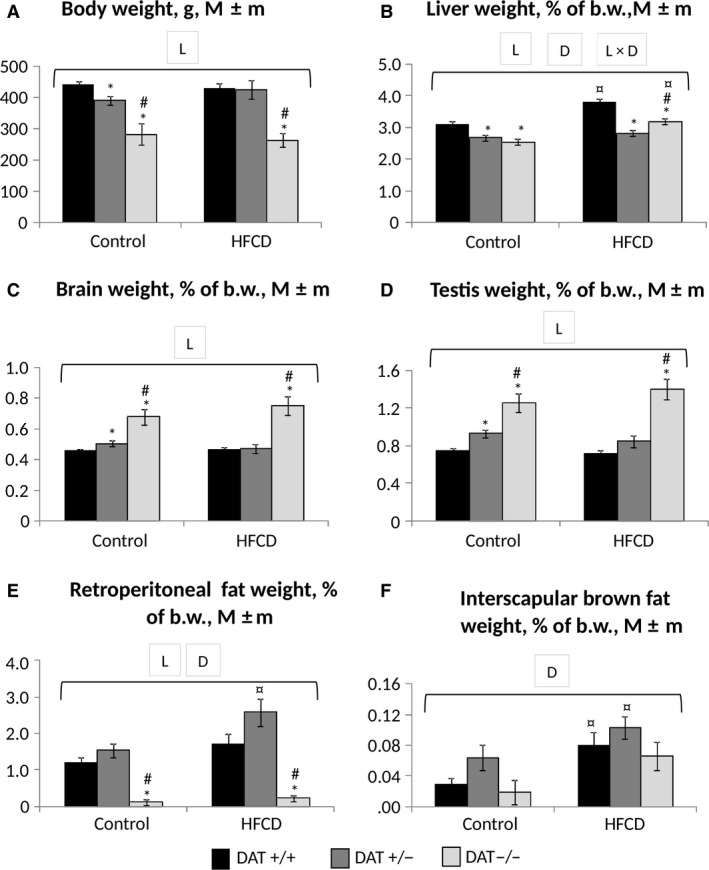
Figure 4.

Integral indices of rats at the end of the experiment. (A) Body weight, g; (B–F) relative weights of the liver, brain, gonads, white and brown adipose tissue, % of body weight. Abscissa axis – groups of animals; ordinate axis – the mean ± standard error of the indicator in the appropriate units. The number of animals per group – see Table 1. *The difference compared with the data for DAT −/− rats is significant; #The difference compared with the data for DAT +/− rats is significant; ¤The difference compared with the animals receiving the control diet is significant, P < 0.05 (Wilcoxon–Mann–Whitney test); horizontal bracket – ANOVA P < 0.05 for “genotype” (L, line), “diet” (D) and their combination by the covered range of values.
