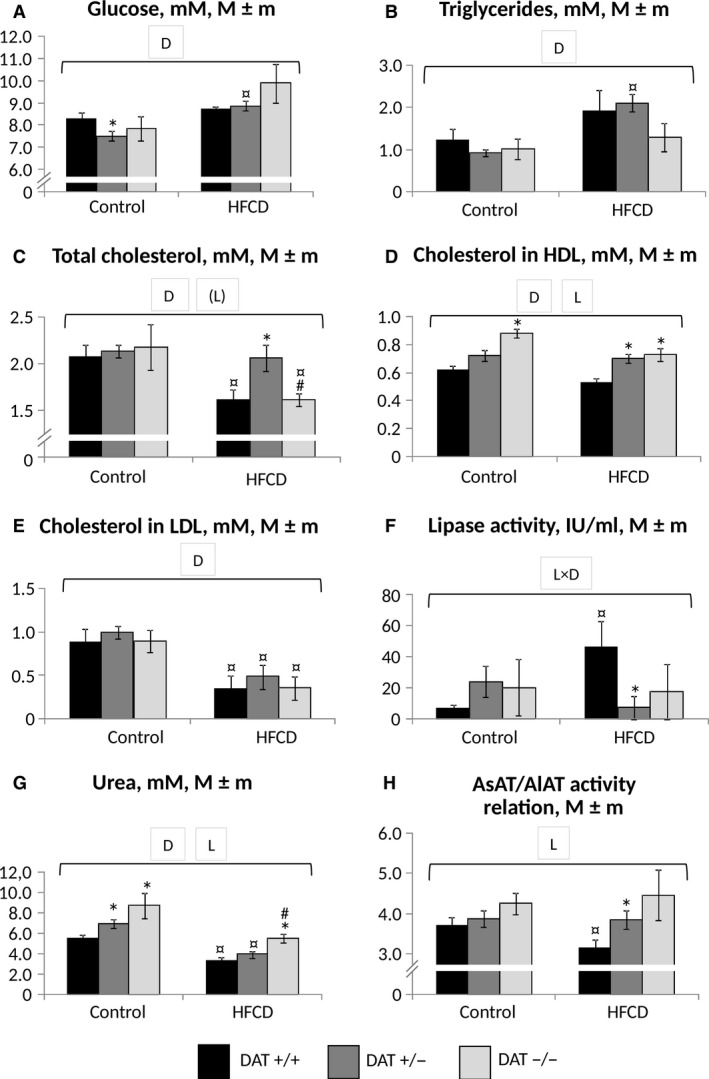
Figure 5.

Biochemical indices of blood plasma in rats at the end of the experiment. (A) Glucose; (B) triglycerides; (C) total cholesterol; (D) HDL cholesterol; (E) LDL cholesterol; (F) lipase (total lipolytic activity); (G) urea; (H) AsAT/AlAT activity ratio. Abscissa axis – groups of animals; ordinate axis – the mean±standard error of the indicator: concentration, mmol/L (A–E, G), activity (F), dimensionless ratio (H). The number of animals per group – see Table 1. *The difference compared with the data for DAT −/− rats is significant; #The difference compared with the data for DAT +/− rats is significant; ¤The difference compared with the animals receiving the control diet is significant, P < 0.05 (Wilcoxon–Mann–Whitney test) horizontal bracket – ANOVA P < 0.05 for “genotype” (L, line), “diet” (D) and their combination by the covered range of values; (L)‐ P < 0.1.
