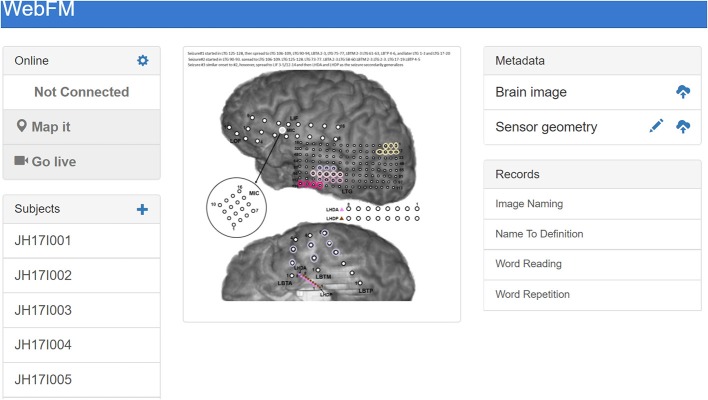
Figure 3.
The landing page for WebFM. A pane in the top left shows system state and houses buttons that start trial-based functional mapping paradigms and a “live” mode that visualizes neural activity on the brain in real-time, as visualized in prior studies (Lachaux et al., 2007). A list of subject identifiers on the bottom left pane enables users to pull up previous/current subjects; a list of saved maps for the selected subject appears in the “Records” pane on the bottom right. The “+” in the top left of the “Subjects” pane allows operators to add new subjects to the database, and the “Metadata” pane at the top right allows operators to upload brain reconstruction images and normalized electrode locations for displaying functional mapping results. The brain images used for mapping are often overlaid with information about seizures and/or ESM results, so that functional activation can be easily visually compared with these data; the image shown in the center includes colored circles depicting the hypothesized spread of ictal activity during the subject's seizures.

