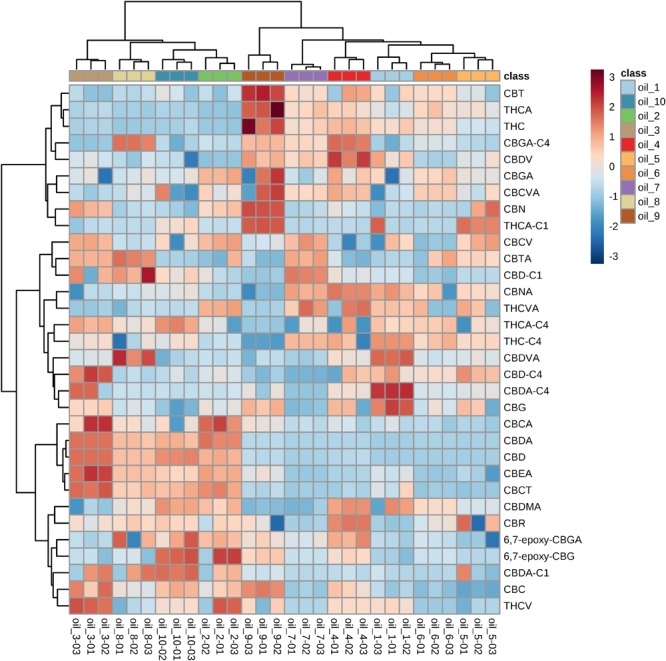
FIGURE 11.

Heatmap built with the identified cannabinoids. Color-coding consists of shades of red and blue, where higher intensity of red stands for very high concentration and higher intensity of blue stands for very low concentration. The samples are shown in colors at the top of the heatmap, while cannabinoids are reported on each row.
