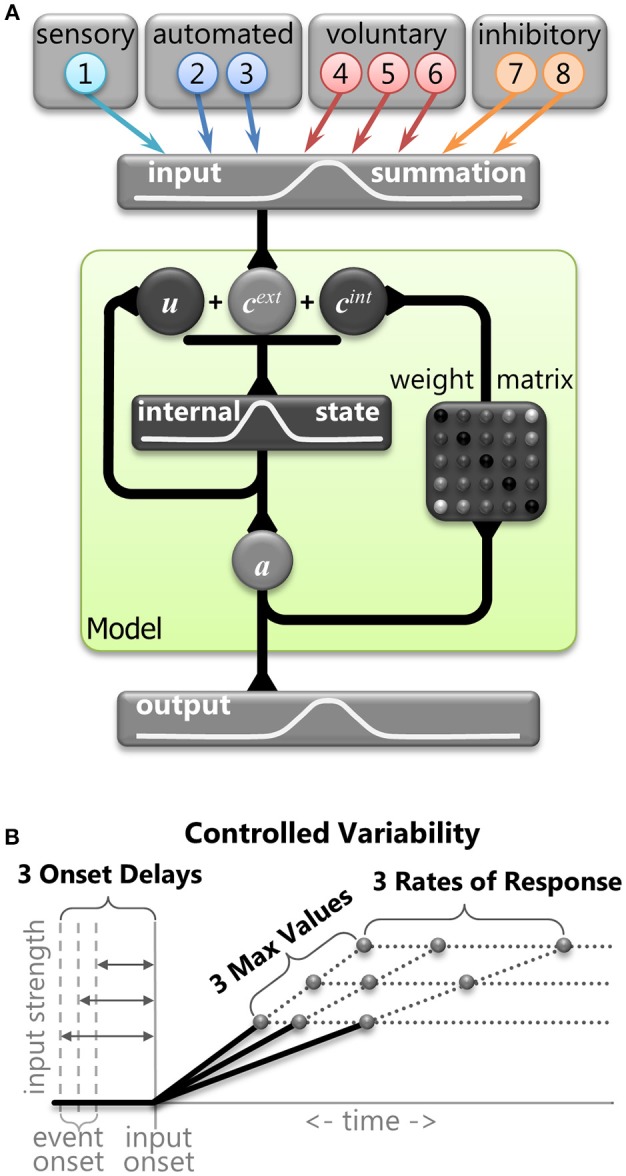
Figure 3.

(A) Graphical representation of the mathematical model. The primary stage shows the eight inputs that were derived from components of neural signals in the brain. The central stage (within the green shaded box) demonstrates the dynamic internal state of the model. Vector cext represents the combination of the external inputs. Vector cint represents the internal connections across the model (Equation 6). Vector u represents internal state of the model (equation 5). Vector a represents output activity from the model (Equation 3). The final stage is the output activity. (B) A graphical representation of the three levels of controlled variability for the Onset Delay, the RoR, and the MaxVal for various inputs (see Table 1).
