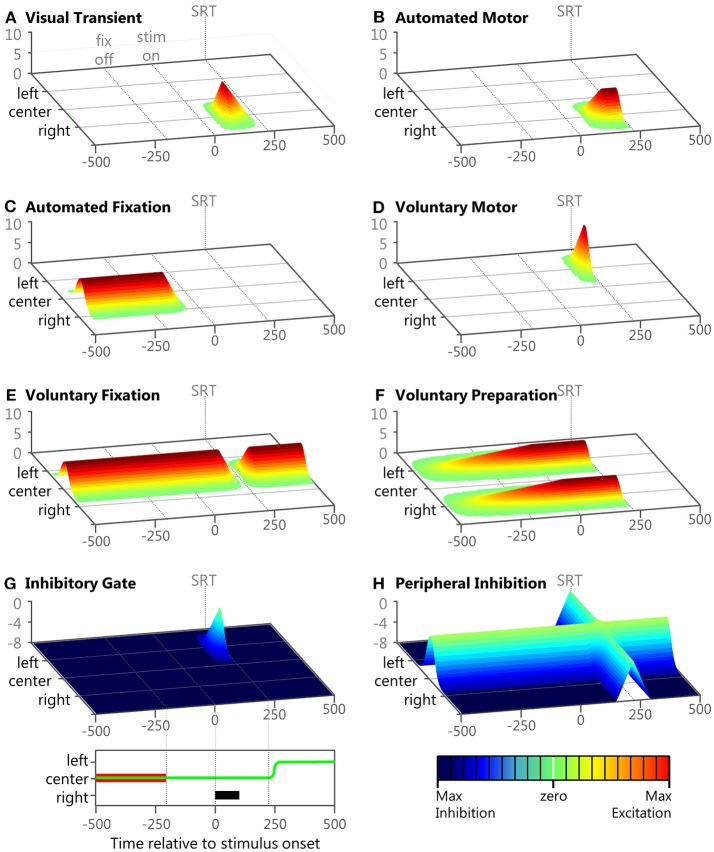
Figure 4.
Examples of the eight inputs during a correct anti-saccade trial. Panels (A–H) show 3D plots of intensity (bottom right legend) over time (bottom left legend) and space for the 8 inputs during an example trial described in the Methods section. The time scale of each panel starts after the model has fixated on the central fixation point. Each panel represents the model's visual space across 100 nodes. The fixation point is presented at the 50th node labeled “center,” the peripheral stimulus is presented at the 75th node labeled “right,” and the anti-saccade goal is the 25th node labeled “left.” At the bottom left is a panel showing task space where the anti-saccade direction is to the left, the fixation is in the middle and the stimulus location is to the right. The fixation point is indicated by the red bar, the peripheral stimulus is indicated by the black bar, and the eye-position is indicated by the green line. At the bottom left is a color map to indicate input strength (in arbitrary units). In each panel, fixation offset is the earliest dotted line (−200 ms), stimulus onset is the middle dotted line (0 ms), and saccade initiation is indicated by the final dotted line.

