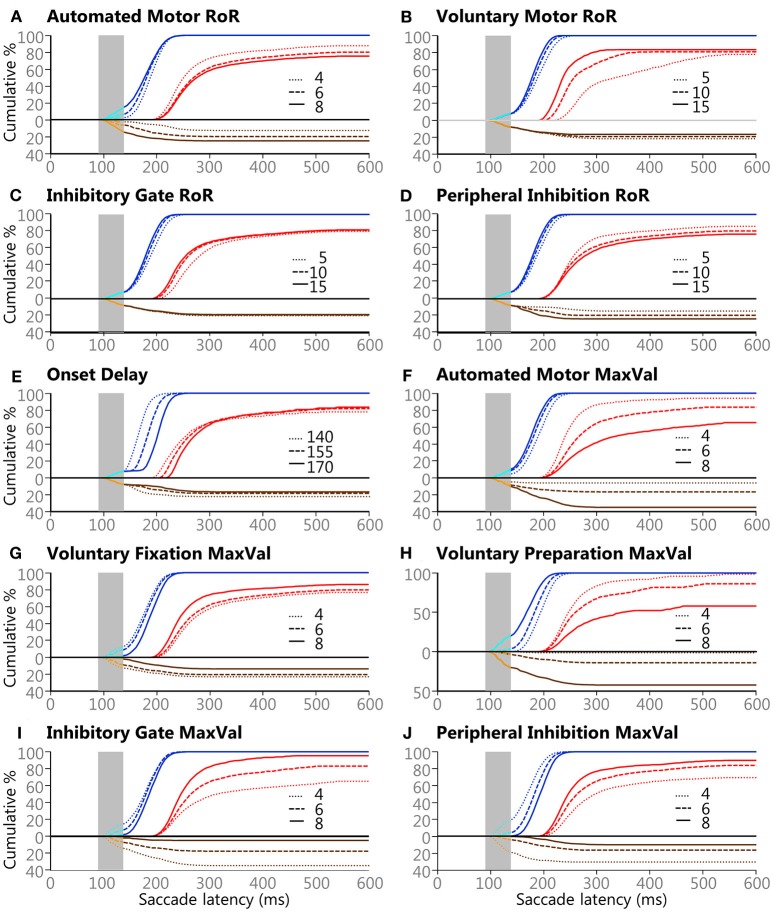
Figure 6.
The effects of the 3 values for the 10 variables on saccade selection and latency. Panels (A–J) show the effects of the Controlled Deterministic Variability for each of the ten manipulated attributes described in the Methods section and Table 1. All blue lines are Regular-Pro, cyan lines are Express-Pro, red lines are Correct-Anti, brown lines are Regular-Errors, and orange lines are Express-Errors. All direction errors are plotted below the zero line for clarity. Solid lines indicate large values for each setting, dashed lines indicate medium value for each setting, and dotted lines indicate small value for each setting. Vertical gray areas indicate the express latency window.

