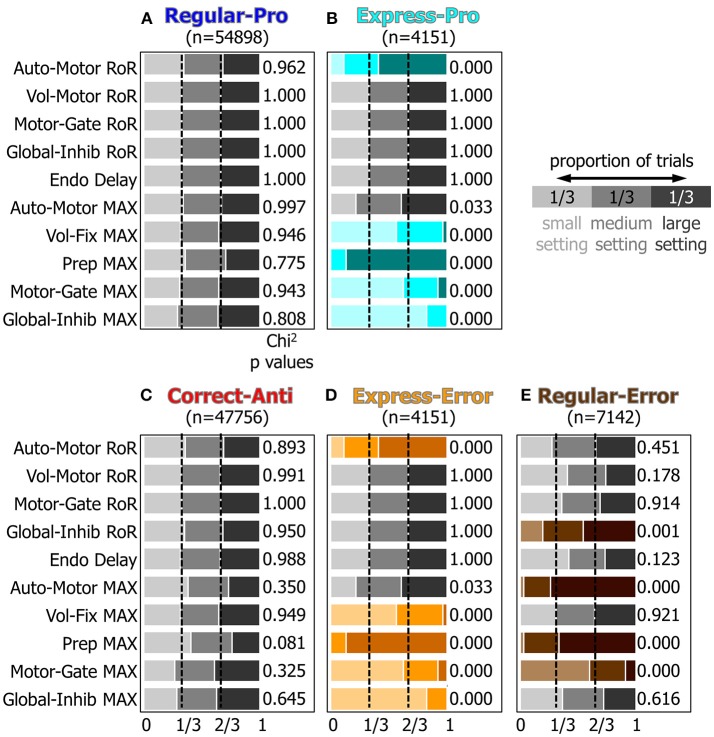
Figure 7.
A visualization of the results of the Chi2 test for the 10 manipulated attributes. Panels (A–E) represent how the ten manipulated attributes, described in the Methods section and Table 1, influenced each behavior's probability. Within each behavior, the proportion of small, medium, and large settings should be equal if that input's setting had no effect on saccade selection. Colored rows indicate which settings had results that were significantly different from the expected proportions of 1/3 for each setting (p < 0.001, chi2 test).

