Figure 8.

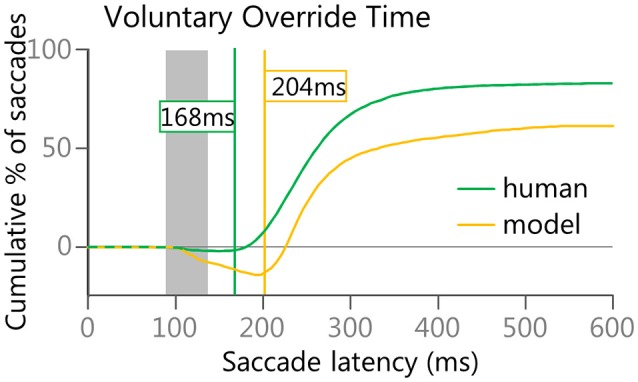
Voluntary Override Time was calculated to estimate when voluntary signals started to override automated signals. The lines in Figure 8 are subtractions of the Red and Orange/Brown lines in Figures 5B,D.

Voluntary Override Time was calculated to estimate when voluntary signals started to override automated signals. The lines in Figure 8 are subtractions of the Red and Orange/Brown lines in Figures 5B,D.