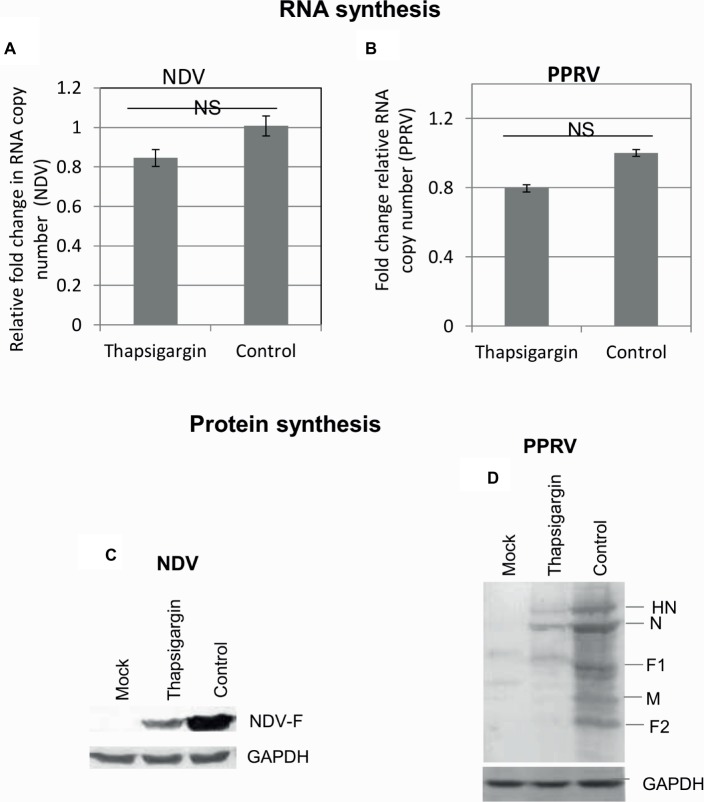
Figure 6.
RNA and protein synthesis. Vero cells were either mock-infected or infected with the indicated viruses at MOI of 10 for 3 h followed by washing with PBS and addition of 0.5 μM Thapsigargin or vehicle control (0.05% DMSO). The cells were scrapped at 9 and 20 hpi, respectively, for NDV and PPRV to prepare the cell lysate. Viral RNA was quantified by qRT-PCR. Ct values were normalized with β-actin house-keeping control gene, and relative fold-change was calculated by ΔΔCt method. Relative fold-change in RNA copy number of NDV (A) and PPRV (B) is shown. The levels of viral proteins were analyzed by Western blot analysis. The levels of viral proteins in NDV (C) and PPRV (D) infected cells are shown. NS = No significant difference.

