Figure 8.
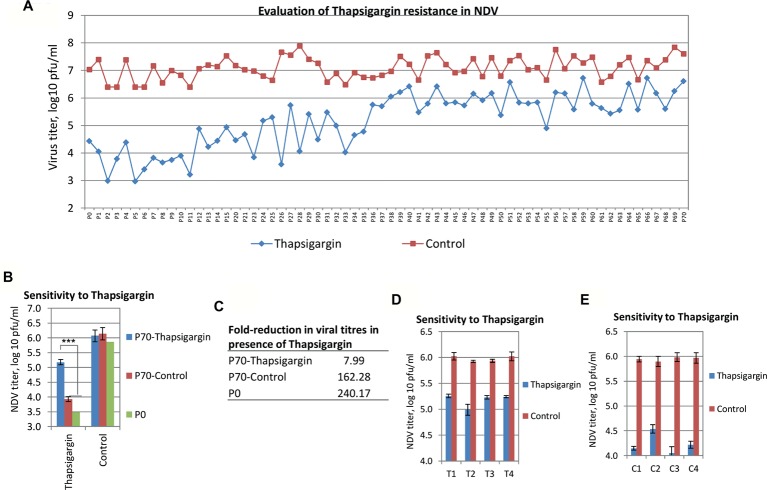
Selection of Thapsigargin-resistant viral mutants. Vero cells were infected with NDV or PPRV at MOI of 0.01 and grown in the presence of either 0.25 μM of Thapsigargin or vehicle control (0.05% DMSO). The progeny virus particles released in the supernatant were harvested either at 72–120 hpi or when ~75% cells exhibited CPE. Seventy (70) such sequential passages were made. (A) The levels of NDV inhibition at various passage levels in Thapsigargin-treated and untreated cells are shown. (B) Sensitivity of P70-Thapsigargin NDV to Thapsigargin: Vero cells, in triplicate, were infected with P0, P70-Thapsigargin, or P70-Control passaged viruses at MOI of 0.1 in the presence of either 0.5 μM Thapsigargin or 0.05% DMSO, and the progeny virus particles released in the supernatant at 24 hpi were quantified. (C) Relative growth (fold reduction) of P0, P70-Thapsigargin, and P70-Control viruses in the presence of Thapsigargin. (D,E) Sensitivity of plaque purified (P70) viruses to Thapsigargin: P70-Thapsigargin or P70-Control viruses were plaque purified [(four plaques each of P70-Control (C1, C2, C3, and C4) and P70-Thapsigargin (T1, T2, T3, and T4)] and amplified in Vero cells. To evaluate the sensitivity to Thapsigargin, plaque purified viruses were infected at MOI of 0.1, and virus yield was measured in the presence of 0.5 μM Thapsigargin or 0.05% DMSO. Error bars indicate SD. Pair-wise statistical comparisons were performed using Student’s t test (*** = p < 0.001).

