Figure 3.
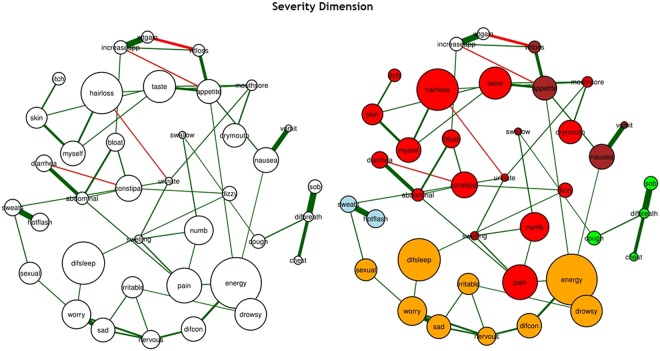
The estimated networks of 38 cancer symptoms across the “severity” dimension (a) without the identified communities and (b) with the identified communities (walktrap algorithm). Nodes represent symptoms and edges represent a partial correlation between the symptoms, after controlling for all of the other correlations of a given node. The 38 cancer symptoms represented in the nodes above are coded in the following fashion: difcon: Difficulty Concentrating, pain: Pain, energy: Lack of Energy, cough: Cough, nervous: Feeling Nervous, hotflash: Hot Flashes, drymouth: Dry Mouth, nausea: Nausea, drowsy: Feeling Drowsy, numb: Numbness or Tingling in Hands or Feet, chest: Chest Tightness, difbreath: Difficulty Breathing, difsleep: Difficulty Sleeping, bloat: Feeling Bloated, urinate: Problems with Urination, vomit: Vomitting, sob: Shortness of Breath, diarrhea: Diarrhea, sad: Feeling Sad, sweats: Sweats, sexual: Problems with Sexual Interest or Activity, worry: Worrying, itch: Itching, appetite: Lack of Appetite, abdominal: Abdominal Cramps, increaseapp: Increased Appetite, wtgain: Weight Gain, dizzy: Dizziness, swallow: Difficulty Swallowing, irritable: Feeling Irritable, mouthsore: Mouth Sore, wtloss: Weight Loss, hairloss: Hair Loss, constipat: Constipation, swelling: Swelling, taste: Change in the Way Food Tastes, myself: I Do Not Look Like Myself, skin: Changes in Skin.

