Fig. 3.
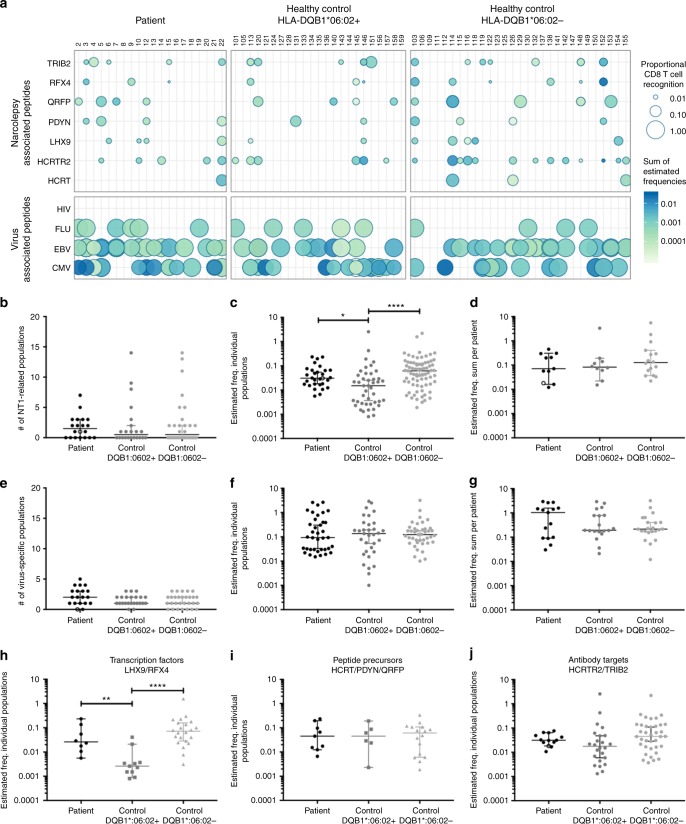
Proportional CD8+ T-cell recognition and estimated frequency of detected NT1-related CD8+ T-cell populations. a Representation of the detected CD8+ T-cell recognition in the cohort, of NT1-relevant proteins (upper panel) and known virus epitopes (lower panel). Each dot represents the sum of all detected CD8+ T-cell populations with specificity towards a given protein for each individual donor. The size of the dot represents the number of peptides recognized by the given donor, relative to the total number of peptides screened for that donor. The color gradient represents the estimated frequency of the sum of NT1-related CD8+ T-cell populations for each donor. b The number of NT1-related CD8+ T-cell populations detected in each donor. c The estimated frequency of each detected CD8+ T-cell population, p = 0.0124 (*) and p < 0.0001 (****) for comparisons between patients and HLA-DQB1*06:02-positive controls and between HLA-DQB1*06:02-positive and negative controls, respectively. (One-way ANOVA and Tukey’s multiple comparisons test on log transformed data). d The sum of the estimated frequency for all NT1-related CD8+ T-cell populations detected in each donor. e, f, and g show the number of NT1-related CD8+ T-cell populations, the estimated frequency of individual populations and the sum for each donor, respectively, for recognition of known virus epitopes. h–j The estimated frequency of NT1-related CD8+ T-cell populations distributed on the different groups of proteins. Related to h, p = 0.0012 (**) and p < 0.0001 (****) for comparisons between patients and HLA-DQB1*06:02-positive controls and between HLA-DQB1*06:02-positive and negative controls, respectively. (One-way ANOVA and Tukey’s multiple comparisons test on log transformed data). Star a or open symbol b–e denotes the one patient that was HLA-DQB1*06:02 negative. Bars represent median values with 95% CI. Number of donors screened, n = 20 for patients, n = 23 for HLA-DQB1*06:02 + controls, n = 29 for HLA-DQB1*06:02- controls

