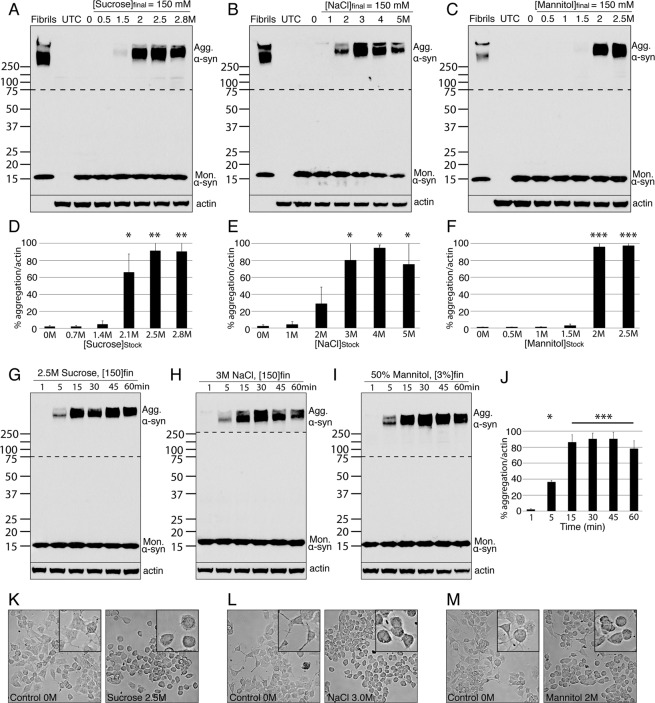
Figure 1.
Hyperosmotic stress induces aggregation of α-syn. (A–C) Western blot gels illustrating the aggregated alpha synuclein (Agg. α-syn) and monomeric alpha synuclein (Mon. α-syn) from cell lysates collected after each treatment. In the first lane, 5pmoles of α-syn fibrils were used as a positive control. In the second lane, whole cell extract from cells overexpressing GFP and treated with the highest concentration of osmolytes were used as a negative control (UTC). (D–F) Bar graphs of the quantifications from the corresponding gel directly above. Error bars represent standard errors between results obtained with N2a and HEK cells. (G–I) Western blot gels presenting the time course of Agg. α-syn over time after each treatment. (J) Bar graph presenting the quantifications of the average of the sucrose, NaCl and Mannitol time course experiments (in panel G–I). (K–M) Light field microscopy images of cells in vitro following the indicated treatment. Insets of high magnification images are provided to demonstrate the morphology of the individual cells. *p < 0.05, **p < 0.005, ***p < 0.0005. The panel size in K-M represents 100 × 100 µm, 25 × 25 µm in the insets. The portion of the blots above the dashed lines was exposed for a longer time compared to the part of the blot below the dashed line (Fig. S4).

