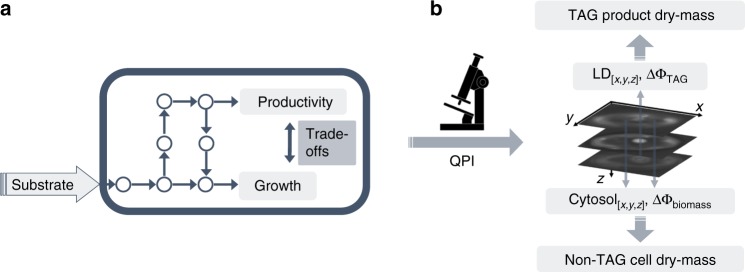
Fig. 1.
Metabolic trade-offs by quantitative mass imaging. a Schematic illustrating substrate uptake and resource partitioning to growth and production, as well as the underlying trade-offs between these two metabolic objectives. b Quantitative phase-imaging (QPI) enables the independent localization (x,y,z) and phase-delay quantification of the cell cytosol (ΔΦcytosol) and TAG loaded lipid droplets (ΔΦTAG). ΔΦcytosol and ΔΦTAG are subsequently converted to their corresponding dry-mass values, enabling trade-off phenotyping between growth and TAG production

