Fig. 3.
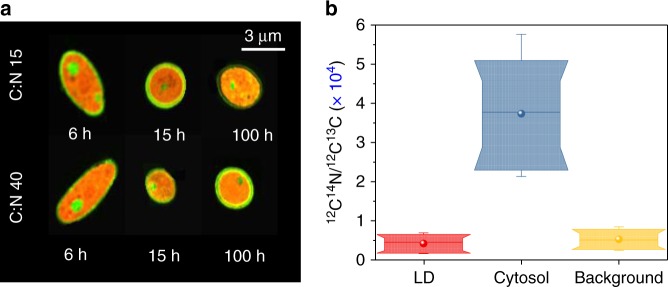
Elemental composition of Y. lipolytica. a NanoSIMS images of the MTYL038 strain at two C/N growth conditions for 6, 15, and 100 h (Methods); the cytosolic pools of naturally abundant 14N and the LD content of 13C are highlighted in red and green, respectively. b Box-plots of 12C14N/12C13C ratio of the cytosolic LDs droplets (red), the cytosol excluding the LDs (blue), and the extracellular background (yellow) for 40 individual single-cell and single-LD observations, for cells sampled at C/N:15 and C/N:40 at 6, 15, and 100 h (Methods). Specifically, nC/N: 15, 6 h = 8, nC/N: 15, 15 h = 2, nC/N: 15, 100 h = 2, nC/N: 40, 6 h = 12, nC/N: 40, 15 h = 4, nC/N: 40, 100 h = 12. Box-plots represent the 10th, 25th, 75th, and 90th percentile, whiskers represent the 5th and 95th percentile, while the median and mean values of the ensemble distribution are indicated by the horizontal line and sphere, respectively

