Fig. 7.
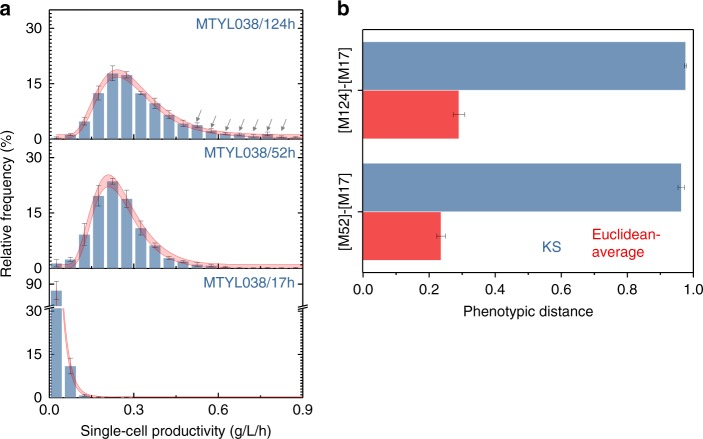
Strain classification by quantitative mass imaging. a Single-cell productivity distributions and concatenated non-linear fits for MTYL03817 (fit: dF = 56, adj-R2 = 0.99, red-x2 = 1.71), MTYL03852 (fit: dF = 56, adj-R2 = 0.94, red-x2 = 3.53), and MTYL038124 (fit: dF = 56, adj-R2 = 0.95, red-x2 = 1.75). Bars and error-bars indicate the mean and standard-error between three biological replicates respectively, while gray arrows indicate the presence of overproducing MTYL038124 subpopulations. In red, the 95% confidence band for each concatenated fit is shown. Strong evidence supported the temporal dependence of productivity at these timepoints (one-way ANOVA, F(2,6) = 116 and p < 0.001). b The Kolmogorov-Smirnov (KS) and Euclidian-average distances of the [MTYL03817–MTYL03852] and [MTYL03817–MTYL038124] pairs. Bars and error-bars indicate the mean and standard-error between three biological replicates, respectively. Strong evidence supported that the Euclidean-average distances between pairs are different (paired-sample t-test, p = 0.02); no such evidence was observed for the KS distances (paired-sample t-test, p = 0.27). Source data are provided as a Source Data file

