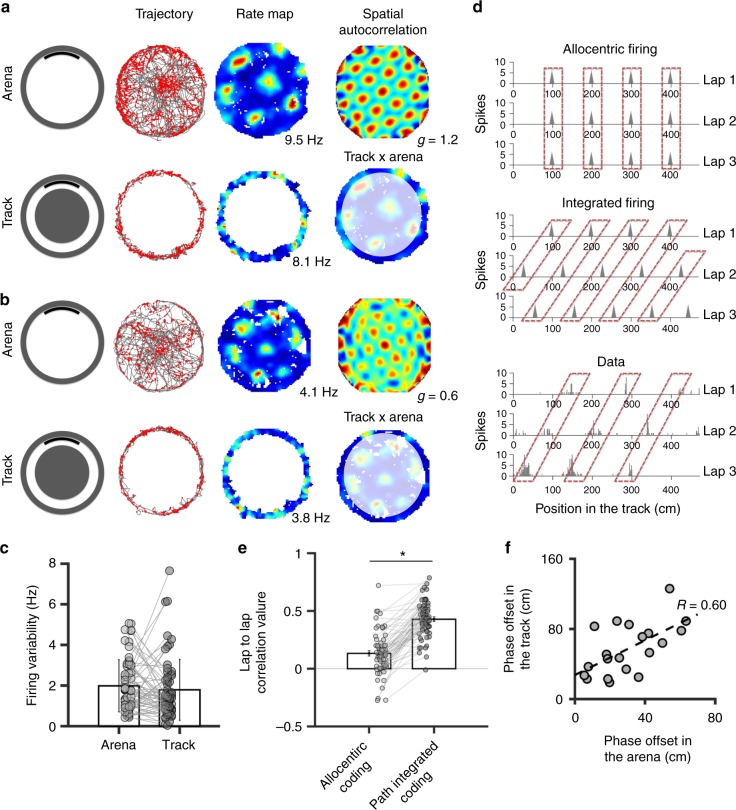
Fig. 2.
Grid cell activity is linearized in the track. a, b Activity of two grid cells recorded in the arena and in the track. Top row: from left to right, rat trajectory (in grey) with spike locations (red dots), color-coded rate maps (the peak of the firing rate is indicated) and 2D autocorrelograms. ‘g’ indicates the gridness score. Bottom row: from left to right, rat trajectory with spike locations, color-coded rate maps observed in the track, and rate maps in arena in which the external area (equivalent to the track) is highlighted. Note that there is no correspondence between the maps in the track and the peripheral area of the arena. c Average firing field variability (±SD) of grid cells in the arena and in the track. Data from individual cells are shown in grey. d diagrams showing rate plots of the activity of one hypothetical grid cell linearized in relation to the track position across three laps, according to the allocentric distance model (top, i.e. the position of the firing fields is stable across laps) and the path integrated distance model (middle, i.e. the position of the firing fields is shifted from one lap to the other). Bottom: activity from one grid cell recorded in the track; note that the position of the firing fields is consistent with the path integrated distance model. e Average correlation (±SEM) of grid cell activity across laps, according to the path integrated coding (i.e. the rate plot of one lap is shifted by a constant value with respect to the previous lap) and the allocentric coding (i.e. no shift between laps). Data from individual cells are shown in grey. *p < 0.05, paired t-test. f Scatter plots showing the relation between the phase offset of 20 pairs of simultaneously recorded grid cells in the arena and in the track. The Pearson correlation coefficient ‘R’ is indicated

