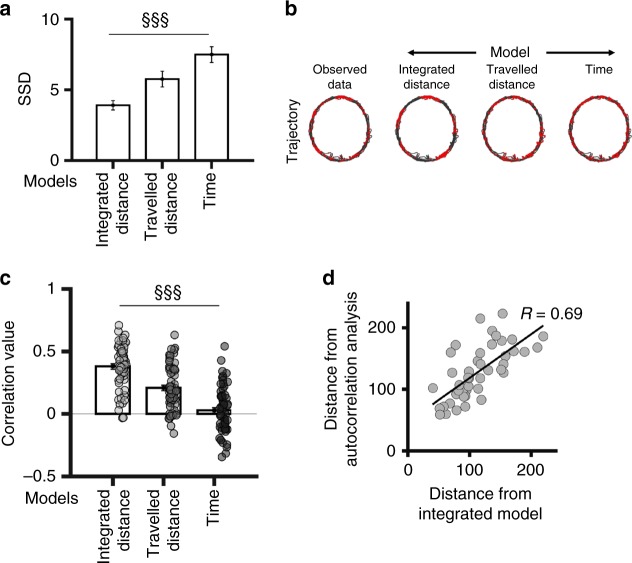
Fig. 4.
Grid cell regularity is based on path integrated distance-model fitting. a Average value (±SEM) of the fitting score (i.e. the sum of squared differences of the best fitting) for the path integrated distance, travelled distance and time model. §§§p < 0.001, repeated measure ANOVA. b Activity of one grid cell in the track from the real data (left) and reconstructed with best-fit parameters for each model (right ‘MODEL’). Real (left) or reconstructed (right ‘MODEL’) trajectory of the animal with spike locations. c Average spatial correlation (±SEM) between the reconstructed maps from each model and the observed maps. Dots represent values from individual grid cells. §§§p < 0.001, repeated measure ANOVA. d Scatterplot showing the relation between the distance (i.e. path integrated distance) calculated with two different methods (i.e. autocorrelations and model fitting); the Pearson correlation coefficient ‘R’ is indicated

