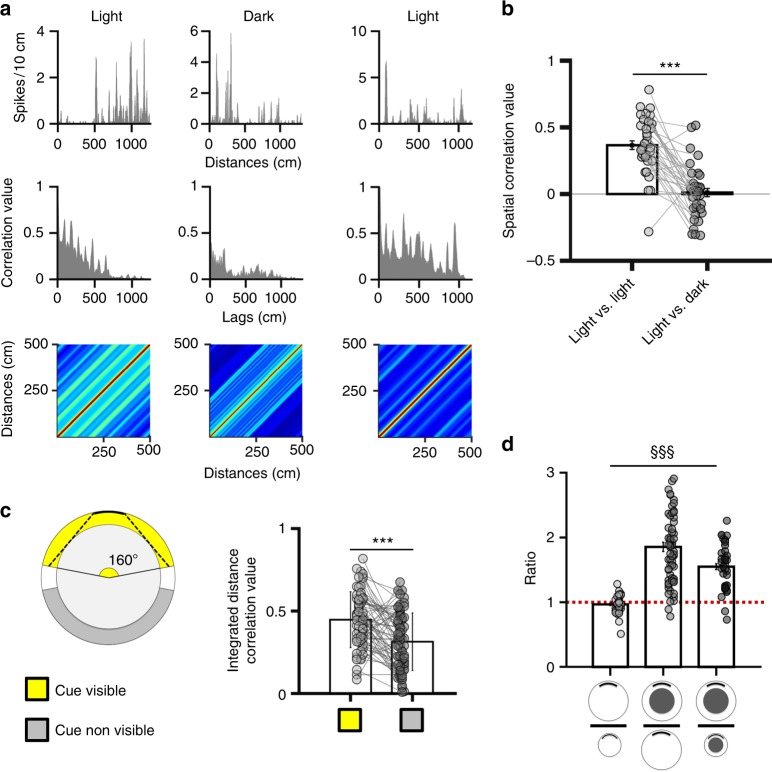
Fig. 5.
Environmental features influence grid cell activity. a Example of the activity of one grid cell linearized according to the path integrated distance model, in both light and dark conditions. Top row: firing rate; middle row: autocorrelation; bottom row: Toeplitz matrix. Note that the regularity is altered in darkness. b Average spatial correlation (±SEM) between the rate plots from all grid cells recorded in the two light sessions (light vs light) and in light vs dark sessions. Data from individual cells are shown in grey. ***p < 0.001, paired t-test. c Left: Diagram showing the two regions of the track in which the cue is visible (yellow) or not (grey). Note that an ambiguous zone (white) was excluded from the analysis, so that the areas of the visible-cue and non-visible-cue region are equivalent. Right: Correlation (±SD) between the integrated distance firing activity in the visible-cue and non-visible-cue region of the track. Data from individual cells are shown in grey. ***p < 0.001 paired t-test. d Ratio (±SEM) between grid cell field distance in the arena and the track; the distance in the track is calculated based on the path integrated distance model. Dashed line indicates a ratio of 1 (i.e. same field distance in the two environments). §§§p < 0.001, repeated measure ANOVA. Note that grid cell field distance is unchanged between large and small arenas, whereas it significantly increases in the large track compared to all other environments

