Figure 3.
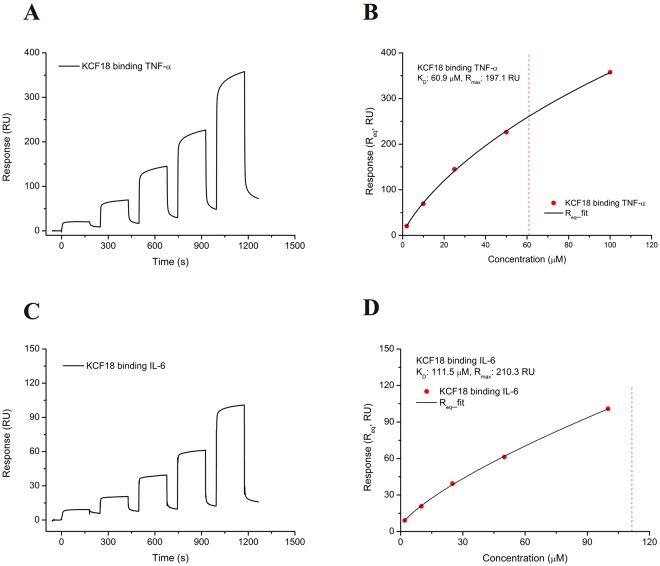
SPR analysis for KCF18 binding to proinflammatory cytokines. (A) KCF18 was injected over TNF-α immobilized on the CM5 sensor chip. As the concentration of KCF18 increased, the measured response for the binding of KCF18 to TNF-α also increased, indicating that binding was concentration dependent. (B) For the steady–state interaction, a binding isotherm was generated to determine the equilibrium KD and Rmax for the binding of KCF18 to cytokine TNF-α, which were found to be 60.9 μM and 197.1 RU, respectively. (C) KCF18 was injected over IL-6 immobilized on the CM5 sensor chip. The measured response for the binding of KCF18 to IL-6 also increased with the concentration of KCF18, similar to the profile of the binding of KCF18 to TNF-α. (D) The kinetic analysis of binding isotherm was also performed to determine the equilibrium dissociation KD and Rmax for KCF18 binding to cytokine IL-6, which were found to be 111.5 μM and 210.3 RU, respectively.

