Fig. 2.
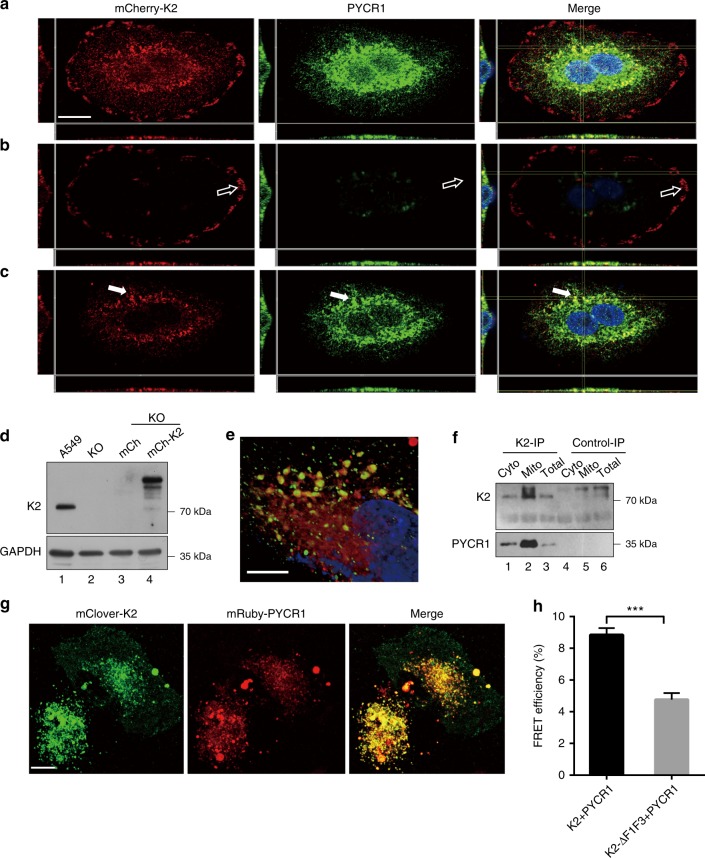
Formation of the kindlin-2-PYCR1 complex in cells. a–e Kindlin-2 KO A549 cells were infected with lentiviral vector encoding mcherry-tag kindlin-2 (mCh-K2) or mcherry vector lacking kindlin-2 sequence (mCh). Three days later, A549 cells (lane 1), kindlin-2 KO cells (lane 2), mCh infectants (lane 3), and mCh-K2 infectants (lane 4) were analyzed by western blotting with antibodies recognizing kindlin-2 and GAPDH (d). Kindlin-2 KO cells expressing mcherry-kindin-2 were stained with anti-PYCR1 antibody and DAPI, and analyzed by confocal microscopy. The maximum-intensity projection views of a representative A549 mCh-K2 cell reconstructed from Z-series images taken at various heights (a). Extended focal planes of focal adhesions show that mcherry-kindlin-2 is concentrated in focal adhesions, whereas there is virtually no PYCR1 in focal adhesions (open arrows) (b). Image layers taken above focal adhesions show that a fraction of mcherry-kindlin-2 is colocalized with PYCR1 in the mitochondria (solid arrows) (c). Fluorescence images of mcherry-kindlin-2 (red), PYCR1 (green), and merged images with DAPI (blue) are shown in the left, middle, and right column, respectively. Scale bar = 15 μm. High-magnification images of mcherry-kindlin-2 (red), PYCR1 (green), and DAPI (blue) taken with focal plane above focal adhesions (e). Scale bar = 7.5 μm. f Co-IP of PYCR1 with kindlin-2 from mitochondrial fraction. Cytosolic fraction (lane 1), mitochondrial fraction (lane 2), and total lysates (lane 3) from A549 cells were analyzed by IP with anti-kindlin-2 antibody (lanes 1–3) or irrelevant mouse IgG (lanes 4–6). The samples were analyzed by western blotting with antibodies to kindlin-2 and PYCR1. g, h FLIM-FRET analyses. Kindlin-2 KO cells were transfected with vectors encoding mClover-kindin-2 or mClover-F1 and F3 deletion mutant of kindlin-2 and mRuby-PYCR1, and analyzed by FLIM. The fluorescence images of mClover-kindin-2 (green), mRuby-PYCR1 (red), and merged images are shown (g). Scale bar = 10 μm. The efficiencies of FRET between the pair of mClover-kindlin-2 and mRuby-PYCR1, or that of mClover-F1 and F3 deletion mutant of kindlin-2 and mRuby-PYCR1 were analyzed (h, at least n = 15 cells per group were counted from at least three independent experiments). Data are shown as mean ± SEM using two-tailed unpaired Student’s t-test, ***p < 0.001

